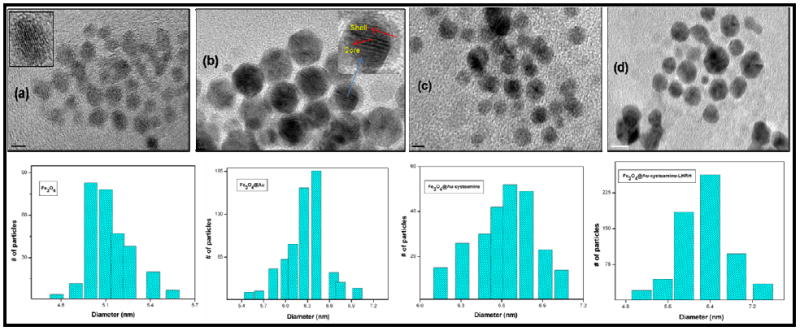
Figure 1.

HRTEM images and size distribution for SPIONs (a), SPIONs@Au (b), SPIONs@Au-Cysteamine (c) and SPIONs@Au-Cysteamine-LHRH (d). From the HRTEM data, the mean size distributions of these particles were found to be in the order of 5.4 ± 0.4, 6.3 ± 0.7, 6.6 ± 0.7, and 6.7 ± 0.8 respectively. (HRTEM bar scale: (a) 5 nm, (b) 2 nm, (c) 5 nm, and (d) 10 nm)
