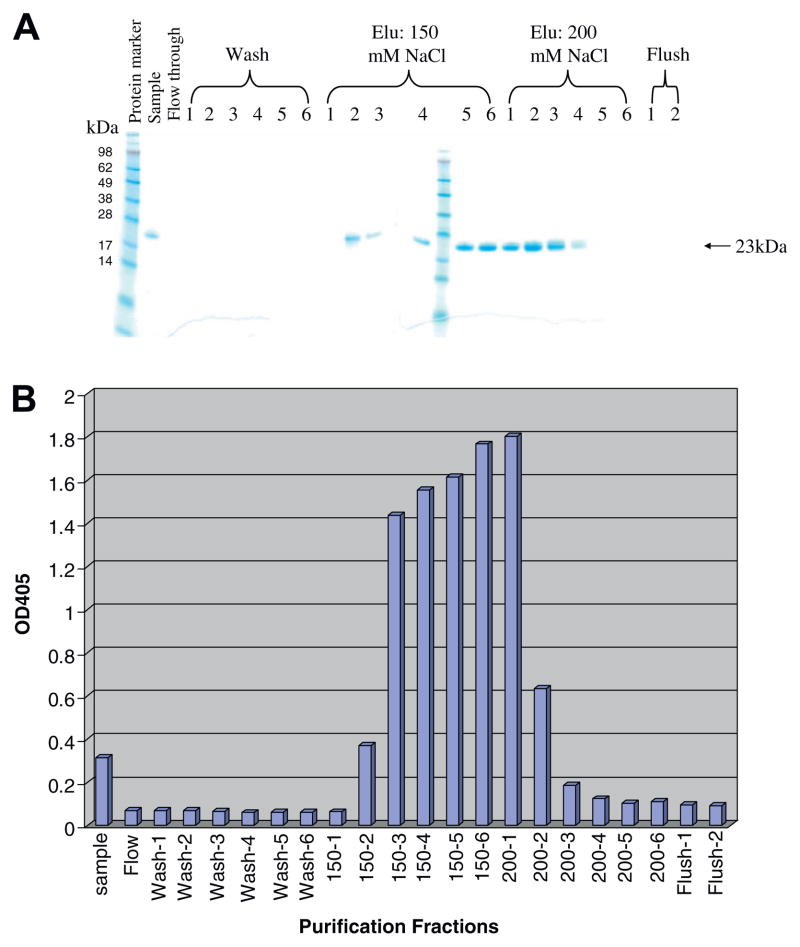
Fig. 2.
Purification and ELISA analysis of porcine CD3εγ single-chain fusion protein. (A) Purification of the refolded porcine CD3εγ single-chain fusion protein using strong anion exchange resin Poros 50HQ; (B) Porcine CD3 mAb 898H2-6-15 binding reactivity to the chromatographed fractions of the refolded porcine CD3εγ single-chain fusion protein. ELISA OD values are on the vertical axis, purification fractions on the horizontal axis. The peak reactivity corresponds to the peak of the porcine CD3εγ single-chain fusion protein elution as shown in Fig. 2A. Data representative of three experiments, p < 0.005.

