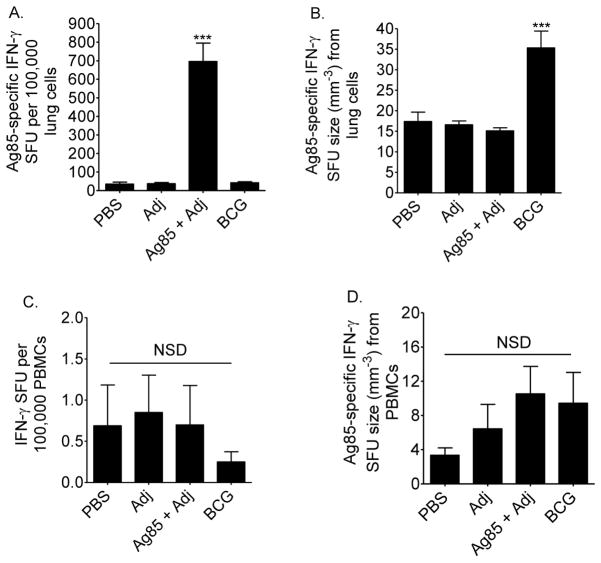
Figure 2. Ag85 responses from vaccinated CBA/J mice.
Mice were injected subcutaneously with PBS, adjuvant (Adj), Ag85 plus Adj, or M. bovis BCG. At least 10 weeks after the first injection, mice were challenged with 50–100 CFU of M.tb, and euthanized 28 days later. Serial dilutions of lung cells (A, B) and PBMCs (C, D) were cultured with Ag85, or ovalbumin (not shown) or anti-CD8/anti-CD28 (not shown) for 36 hours on anti-IFN-γ coated ELISPOT plates to quantify the frequency of responding cells and the amount of IFN-γ produced by each responding cell. Results are the average ± SEM of 3 independent experiments. Each experiment had 5–6 mice per strain per time point; total n = 15 to 18 mice per group. Data were analyzed by one-way ANOVA with Tukey’s posttest, *p<0.05, ***p<0.001, NSD = no significant difference.

