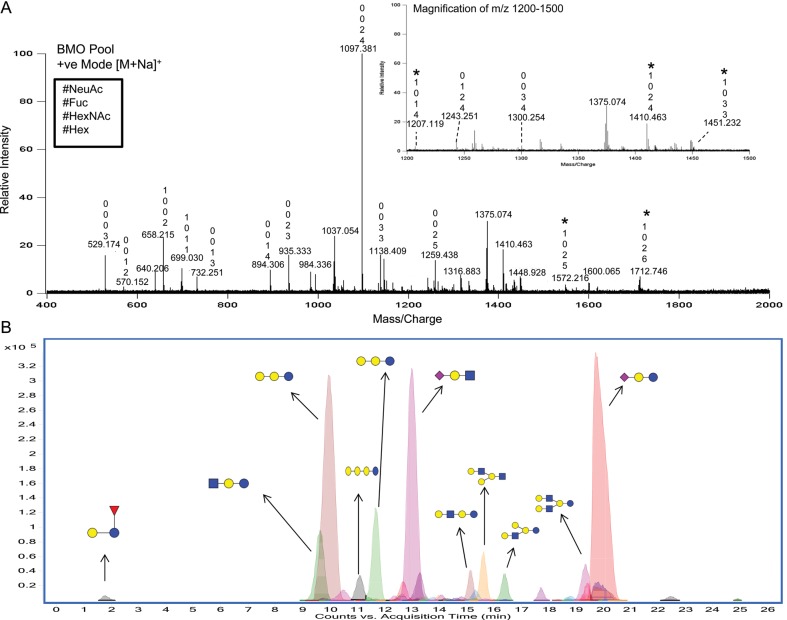
Fig. 1.
(A) The MALDI FT-ICR MS profile of a reduced BMO pool in the positive-ion mode. The numbers shown above the peaks represent, from bottom to top, the number of Hex, HexNAc, Fuc and NeuAc residues. Most ions are [M+Na]+ and the [M-H+2Na]+ ions are denoted with a star. (B) The -HPLC-Chip/TOF MS profile of the reduced BMO pool. Major peaks are labeled with putative structures, where blue circles denote Glc, blue squares denote GlcNAc, yellow circles denote Gal, purple diamonds denote NeuAc and red triangles denote Fuc. (These symbols are used throughout all figures.)

