
Figure 1.
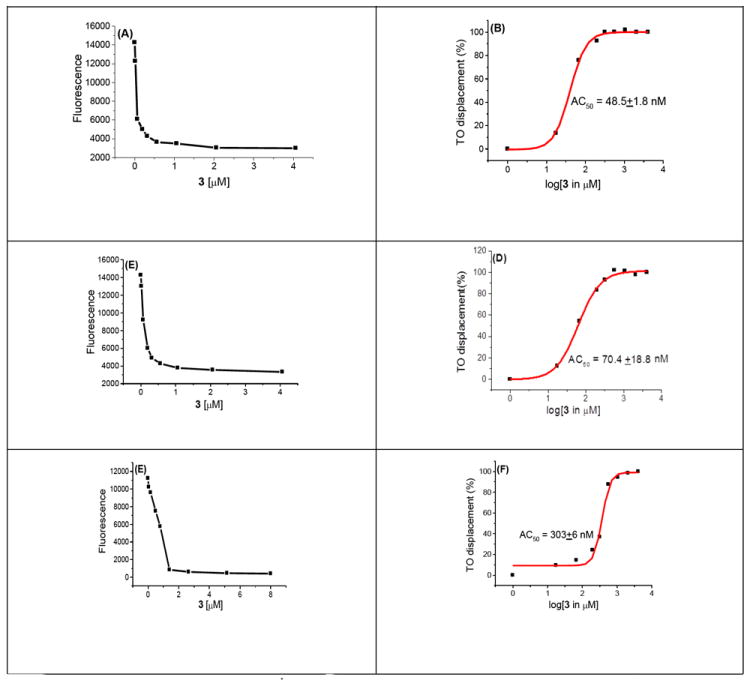
A graphical representation of the FID assay to calculate the AC50 value of 3 with various polynucleotides. (A) Plot showing decrease in the fluorescence intensity of C. Perfringens–TO complex as a function of increasing concentration of 3. (B) A sigmoidal fit between percentage of thiazole orange displaced from C. Perfringens as a function of log [3]. (C) Plot showing decrease in the fluorescence intensity of C. Thymus –TO complex as a function of increasing concentration of 3. (D) A sigmoidal fit between percentage of thiazole orange displaced from C. Thymus as a function log [3]. (E) Plot showing decrease in the fluorescence intensity of M. Lysodeiktius–TO complex as a function of increasing concentration of 3. (F) A sigmoidal fit between percentage of thiazole orange displaced from M. Lysodeiktius as a function of log [3]. Buffer conditions: 100 mM KCl, 10 mM SC, 0.5 mM EDTA, pH 6.8. [polynucleotide] = 0.88 μM/bp, [TO] = 1.25 μM. The reported AC50 value in each case is an average of three separate experiments.