
Figure 2.
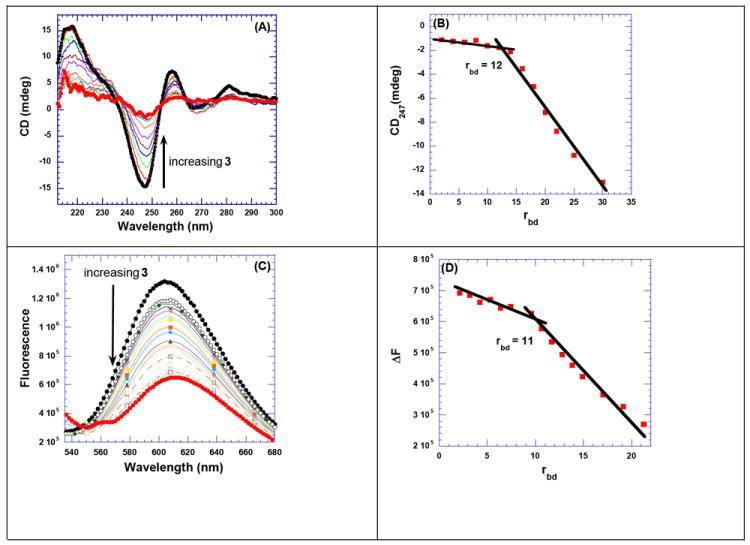
(A) CD titration of poly(dA).poly(dT) with increasing concentration of 3. The figure represents normalized molar ellipticity for CD titration of poly(dA).poly(dT) with 3. The continuous changes in the CD spectra correspond to the incremental amount of 3 ranging from a rbd of 0 to 30. (B) A plot of normalized molar ellipticity versus rdb for CD titration of poly(dA).poly(dT) with 3. The continuous lines in the plot reflect the linear least-squares fits of each apparent linear domain of the experimental data (filled circles) before and after the apparent inflection point. Molar ellipticity is per molar base pairs and rbd = ratio of the base pair/drug. (C) Raw fluorescence emission spectrum of poly(dA).poly(dT)–EtBr complex with increasing concentration of 3. The decrease of fluorescence intensity (at 618 nm) of poly(dA).poly(dT)–EtBr complex with increasing concentration of 3 is observed. (D) The plot of change in the fluorescence as a function of rbd gives the binding site size of 3 with poly(dA).poly(dT). The solution was incubated for 1 h at 20 °C before titrating with 3. The solutions were equilibrated for 5 min. after each ligand addition, and before taking the fluorescence emission scans. Buffer conditions: 100 mM KCl, 10 mM SC, 0.5 mM EDTA, pH 6.8. [DNA] = 10 μM/bp (for fluorescence titration) and 40 μM/bp (for CD titration).