
Figure 4.
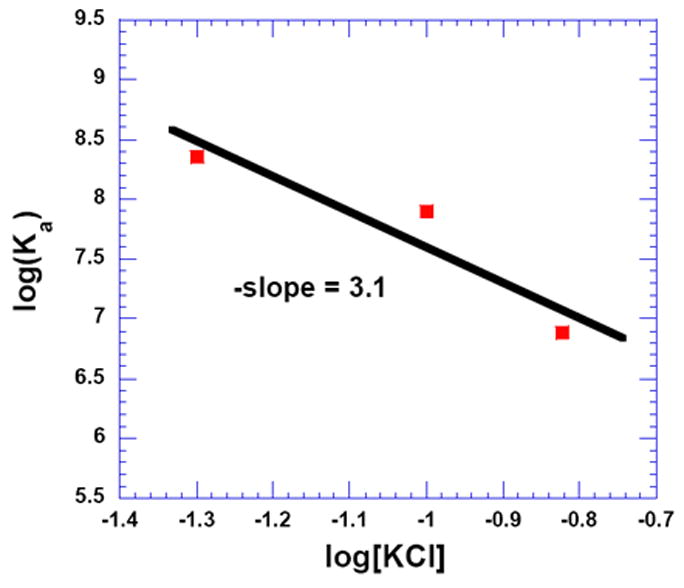
Plot showing the salt dependence of binding between 3 and d[5’-A12-x-T12-3’] in 10 mM SC, 0.5 mM EDTA, pH 6.8. The experimental data were fit with linear regression, and the solid black line reflects the linear fit. T = 20 °C.
Official websites use .gov
A
.gov website belongs to an official
government organization in the United States.
Secure .gov websites use HTTPS
A lock (
) or https:// means you've safely
connected to the .gov website. Share sensitive
information only on official, secure websites.
Plot showing the salt dependence of binding between 3 and d[5’-A12-x-T12-3’] in 10 mM SC, 0.5 mM EDTA, pH 6.8. The experimental data were fit with linear regression, and the solid black line reflects the linear fit. T = 20 °C.