
Figure 9.
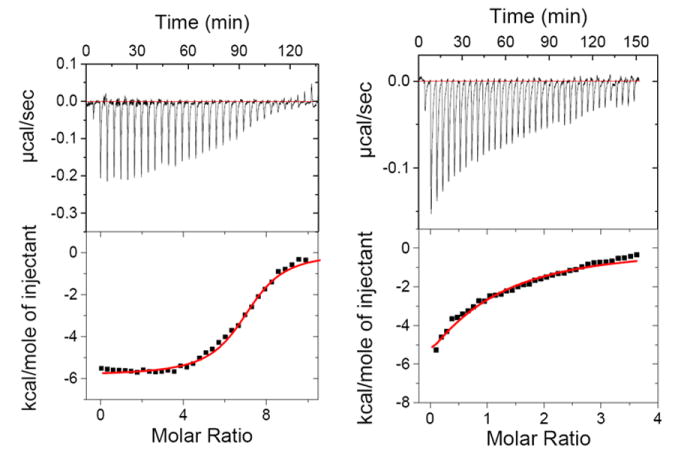
ITC titration profile of d[5’-G3G5C5C3-3’] with 3 (left) and d[5’-A3G5C5T3-3’] with neomycin (right). Top panel: ITC titrations represent the heat burst curves and each heat burst curve is a result of 9 μL injection of ligands into the duplex DNA. The area under each heat burst curve was calculated by integration and yields the associated injection heats which were then plotted as a function of molar ratio of drug to DNA in the lower panel in each figure. Lower Panel: Corrected injection heats plotted as a function of the [drug]/DNA ratio. Buffer conditions: 100 mM KCl, 10 mM SC, 0.5 mM EDTA, pH 6.8. T = 25°C. [3] = 225 μM. [DNA] = 6 μM/duplex, [neomycin] = 250 μM.