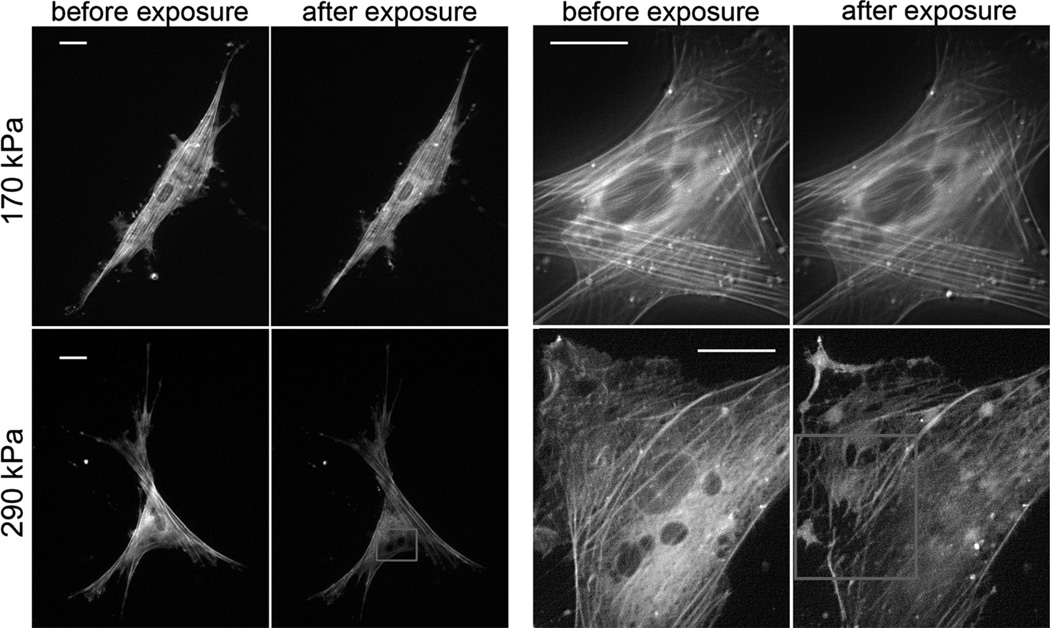
Fig. 2.
Live YFP-actin network staining of cells before and 5 min after exposure to 170 kPa (top panel) and 290 kPa (bottom panel) acoustic pressures. Regions with perturbed actin structure (bottom panel—left) and disrupted individual fibers (bottom panel—right) are marked by squares in 10× and 40× magnification images correspondingly. Scale bar 10 µm.

