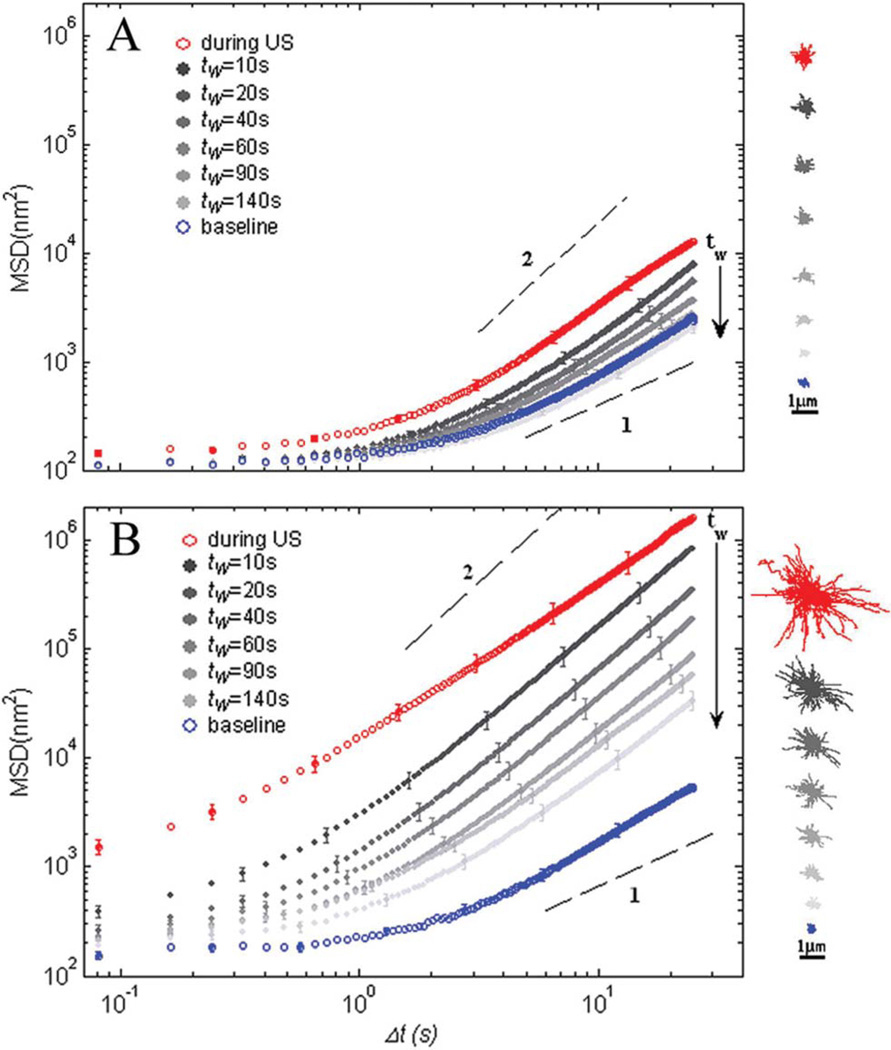
Fig. 5.
MSD of beads tightly bound to cell cytoskeleton as a function of time lag after application of moderate, 170 kPa (A) or higher, 290 kPa (B) acoustic pressures. For both irradiation regimes the MSD measurements were taken before exposure to ultrasound (blue symbols), during exposure (red symbols), and after exposure removal (gray symbols). n = 280 and 320 beads for A and B correspondingly, and the error bars represent the standard error of MSD for each experiment. Waiting time, tw, indicates consequent time intervals after ultrasound removal. The dashed lines show diffusion exponents of 1 and 2. Insets: representative trajectories of 30 tracers, during each time interval.

