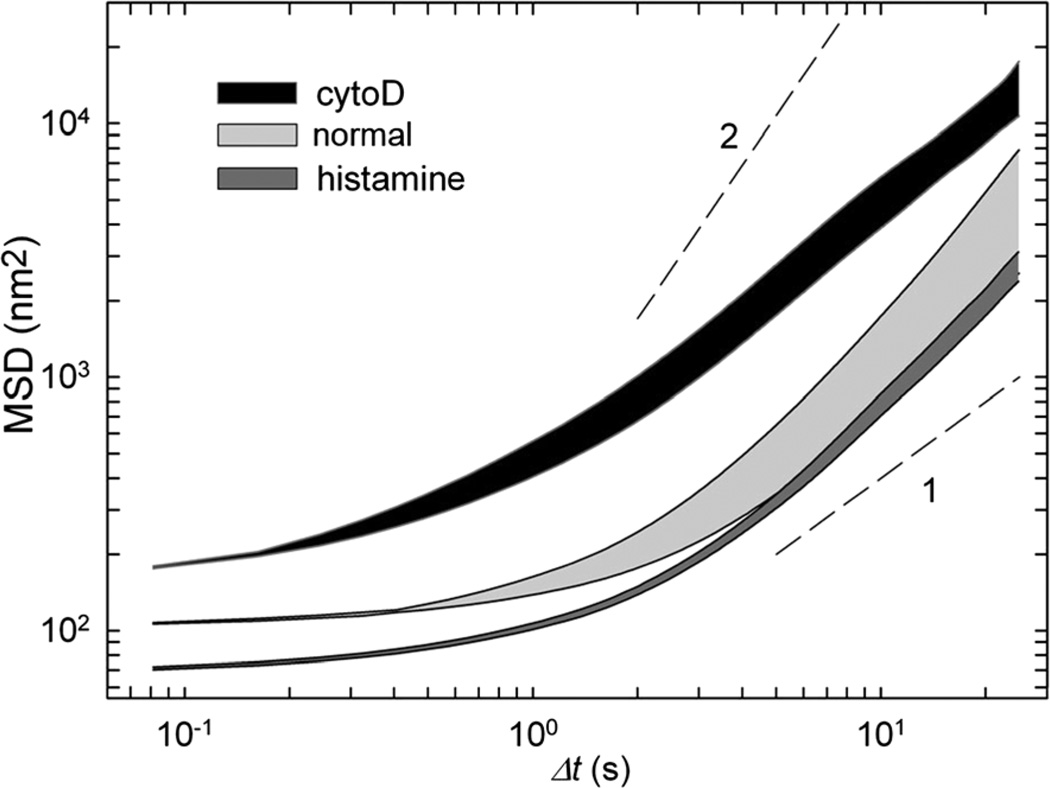
Fig. 7.
MSD intervals represented by the area restricted between the baseline MSD values (bottom line) and values obtained immediately after exposure to 170 kPa ultrasound (top line). Three min after exposure to ultrasound, all MSD curves returned to the baseline position. Each area represents different conditions: untreated cells (light gray), cells treated with histamine (dark gray) and cells pretreated with cytochalasin D (black). The dashed lines show diffusion exponents of 1 and 2.

