Figure 2.
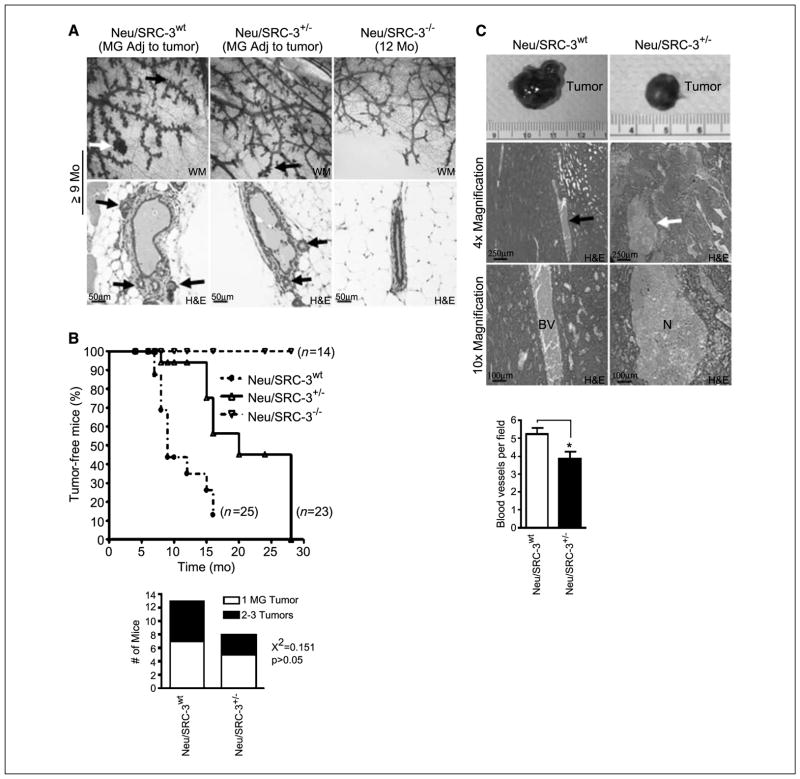
Reduced SRC-3 levels in MMTV-Neu mice increase the latency of Neu-driven mammary tumorigenesis. A, representative mammary gland whole mounts (magnification, 10×; top) and H&E (magnification, 20×; bottom) stained tissue sections from mammary glands adjacent to tumors from Neu/SRC-3wt, Neu/SRC-3+/−, and Neu/SRC-3−/− mice. The data is representative of four mice examined from each genotype. Black arrows, lateral side-budding; white arrow, presence of a typical hyperplastic alveolar nodule (top). B, top, Kaplan-Meier analysis of tumor-free incidence comparing Neu/SRC-3wt with the Neu/SRC-3+/− and Neu/SRC-3−/− mice. Bottom, quantification of the number of tumors per mouse from Neu/SRC-3+/− (n = 8) and Neu/SRC-3−/− mice (n = 13) was analyzed using χ2 test. C, photographs showing representative primary mammary tumors harvested from Neu/SRC-3wt (9 mo of age) and Neu/SRC-3+/− (19 mo of age) mice (top). Representative paraffin-embedded H&E-stained mammary tumors [magnification, 4× (middle) and 10× (bottom)] from Neu/SRC-3wt (n = 7 mice analyzed) and Neu/SRC-3+/− mice (n = 3 mice analyzed). Representative blood vessels (BV; left). Representative areas of necrosis (N; right). The bar chart represents the quantification of the number of blood vessels per field in tumors from the Neu/SRC-3wt (n = 8) and Neu/SRC-3+/− (n = 3) mice. Ten fields were counted per mouse (magnification, 40×). Columns, mean; bars, SD. *, P < 0.05, Student’s t test.

