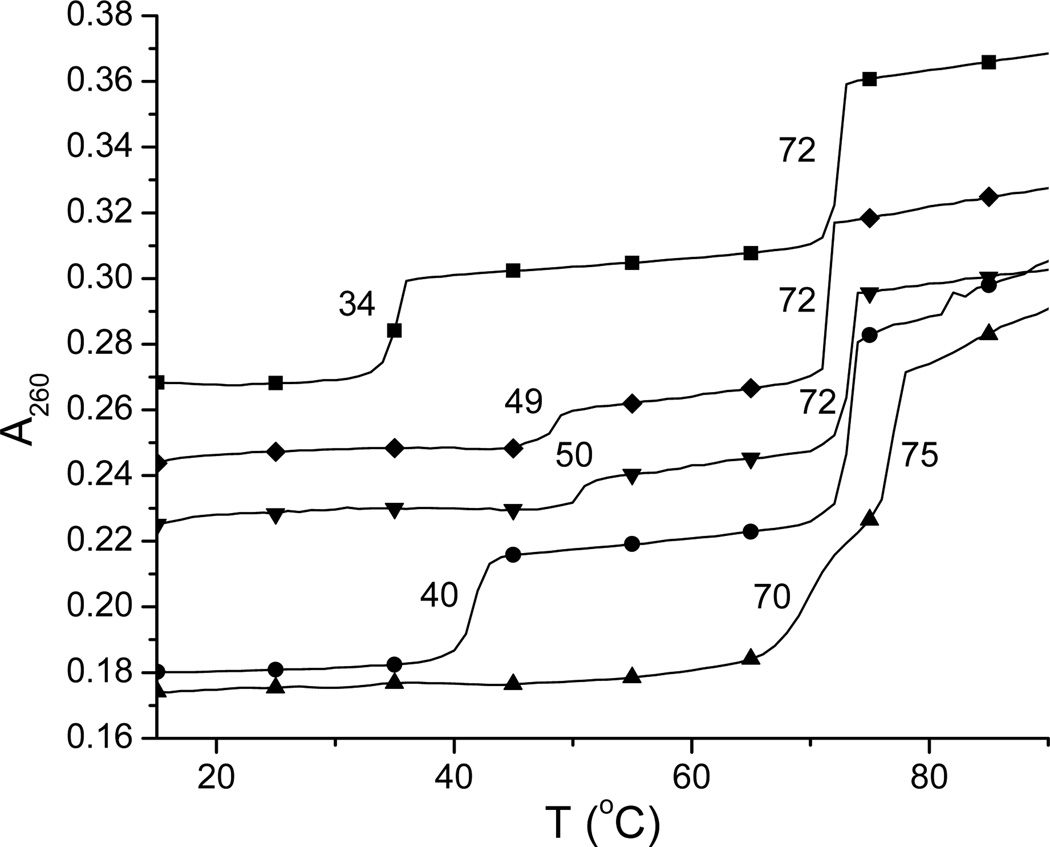
Figure 3.
Representative UV melting profiles of poly(dA)•2poly(dT) at 260 nm in the absence (■) and presence of neomycin (4 µM, ♦), neomycin + 7 (4 µM each, ▼), 7 (4 µM, ●), and 3 (4 µM, ▲). Experimental conditions: sodium cacodylate buffer (10 mM, pH 6.8), KCl (150 mM), and EDTA (0.5 mM). [DNA] = 15 µM per base triplet. The y-axis has been artificially offset to differentiate the melting curves.

