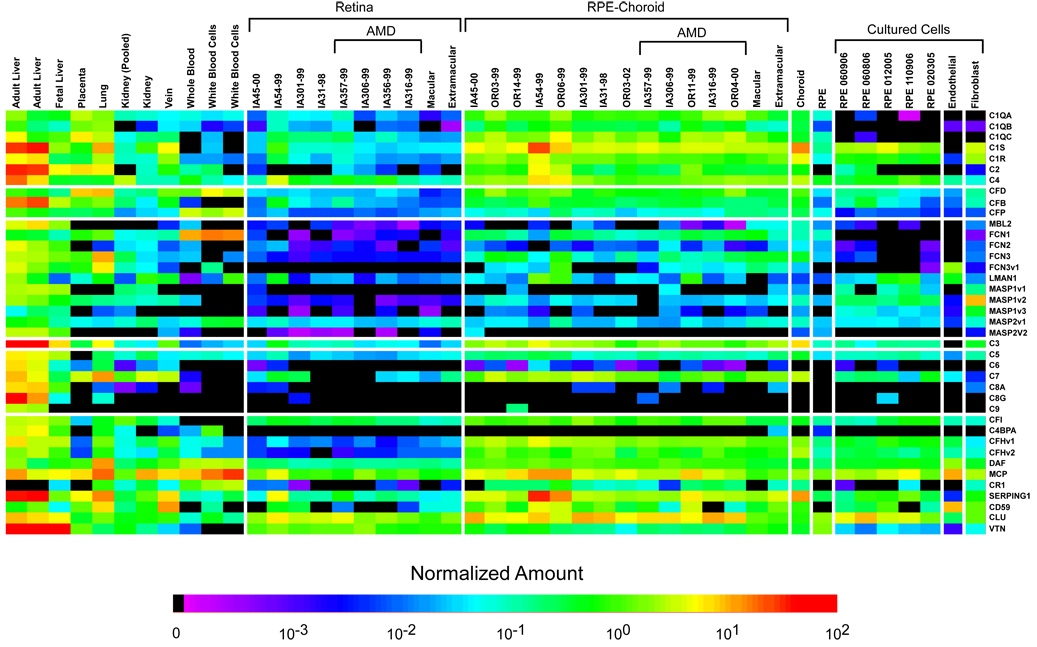
Figure 2.
Complement expression profiles of cells and tissues used in this study. The normalized expression values, as determined by real-time quantitative PCR, for all of the genes analyzed, are depicted graphically in the form of a pseudocolored heatmap. The numerical values can be found in Supplemental Table 3.

