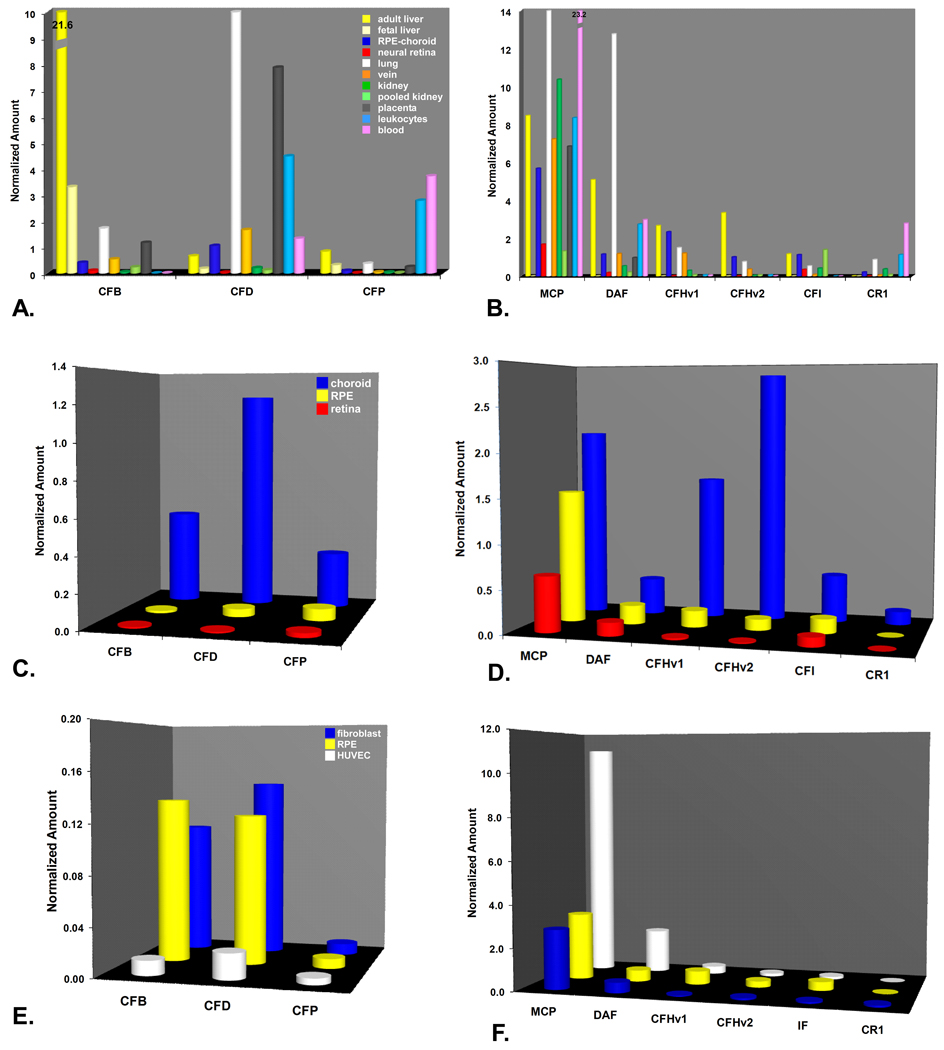
Figure 4.
Real-time quantitative PCR analysis of gene expression in alternative pathway-related genes. A-B. Expression profiles of alternative pathway components (A) and regulators (B) in the same set of tissues shown in Figs. 1A-B. Note off-scale expression levels of CFB (21.6) in adult liver and MCP (23.2) in leukocytes. C-D. Expression profiles of alternative pathway components (C) and regulators (D) in tissue isolates. Choroid (blue), RPE (yellow), retina (red). E-F. Expression levels of alternative pathway components (E) and regulators (F) in cultured human fibroblasts (blue), RPE (yellow), and HUVECs (white). Note the relatively low levels of alternative pathway component expression in the cultured cells (E) relative to the intact choroids (C).

