
Figure 1.
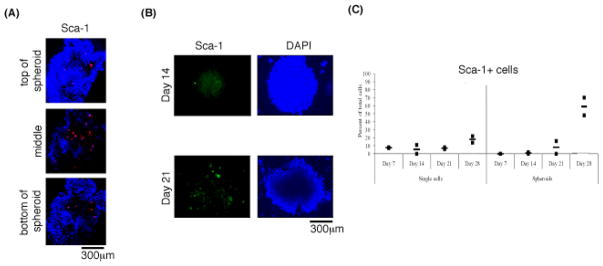
Spatial and temporal distribution of Sca-1+ cells. (A) Confocal Z-stack (60μm) spheroid showing Sca-1+ cells (red) in the center. (B) Increasing number of Sca-1+ cells (green) in spheroids over time. (C) Flow cytometry data showing no increase in percentage of Sca-1+ cells amongst single cells but an increasing percentage in spheroids over time.