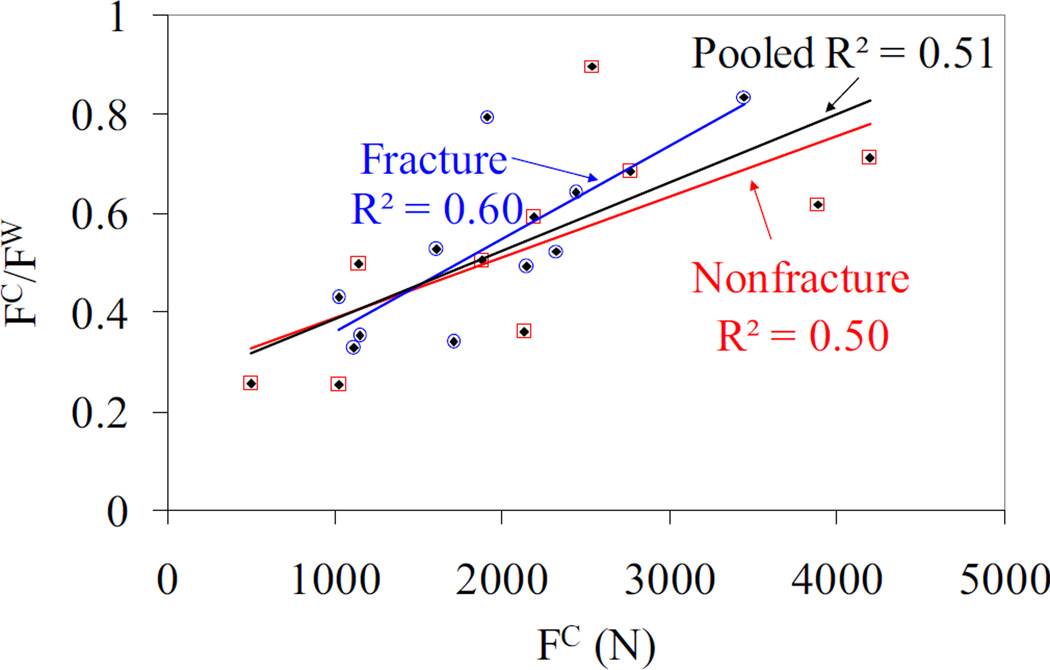
Figure 5.
Cortical bone fracture load vs. ratio of cortical to whole bone fracture load for fracture, nonfracture and pooled data. Note that the blue hollow circles, red hollow squares, and black diamonds correspond to fracture, nonfracture and pooled data, respectively. The nonfracture, fracture and pooled data has a statistically significant correlation with p = 0.02, p < 0.01 and p < 0.001, respectively.

