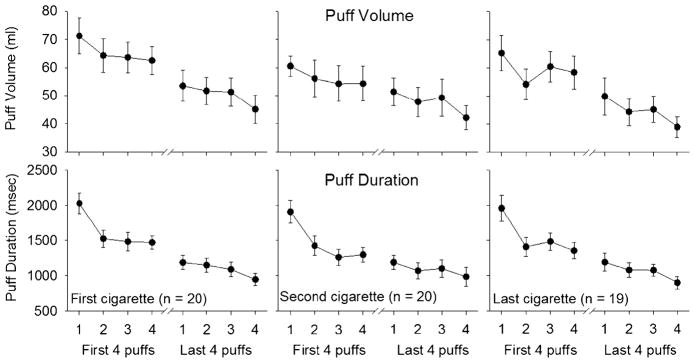
Fig. 1.

Mean volume of smoke inhaled and puff duration during the first, second, and the last cannabis cigarettes smoked each day. Error bars represent standard error of the mean. Data are averaged over 4 days. Only data for the first four puffs and last four puffs are shown due to variability in the number of puffs taken across cigarettes
