Figure 1.
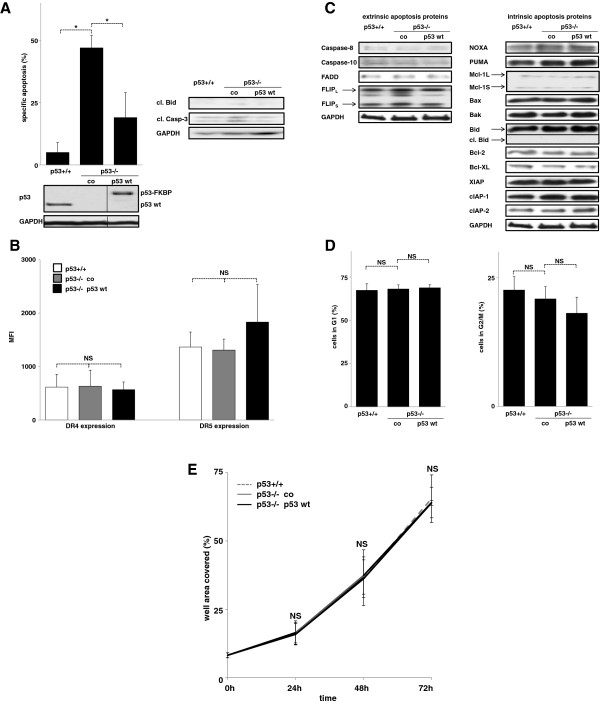
Impact of p53 on extrinsic apoptosis sensitivity in HCT116 cells. A) HCT116 p53+/+, untransfected HCT116 p53-/- cells (co) and HCT116 p53-/- cells transfected with pCDH p53 in wild-type conformation (p53 wt) were stimulated with TRAIL (100 ng/ml) for 48 hours. Measurements of cell death induction (left panel) and cleavage of Bid and Caspase-3 (Casp-3; right panel) are presented. Western blot analysis was performed of total cellular protein. For the ease of reading, the order of samples within the identical blot was rearranged without any further manipulation, indicated by the separating lines. cl = cleaved. B, C) Cells from Figure 1A were analyzed for TRAIL death receptor (B) and apoptosis signaling protein (C) expression. DR4 and DR5 expression was determined by FACs surface staining. The MFI (mean fluorescence intensity) was determined in the APC-Cy7 channel of a LSR II flow cytometer as described in Methods. cl. Bid = cleaved Bid. D, E) Cells from Figure 1A were analyzed for cell cycle distribution using propidium iodide staining (D) and for spontaneous growth by automated analyses of the well area covered over time (E). Cell death induction of adherent cells was measured by Nicoletti staining. Specific apoptosis was calculated as [(apoptosis of stimulated cells at end point minus apoptosis of unstimulated cells at end point) divided by (100 minus apoptosis of unstimulated cells at end point) times 100]. Statistical analysis was performed using one way RM ANOVA. *p < 0,05, NS = statistically not significant.

