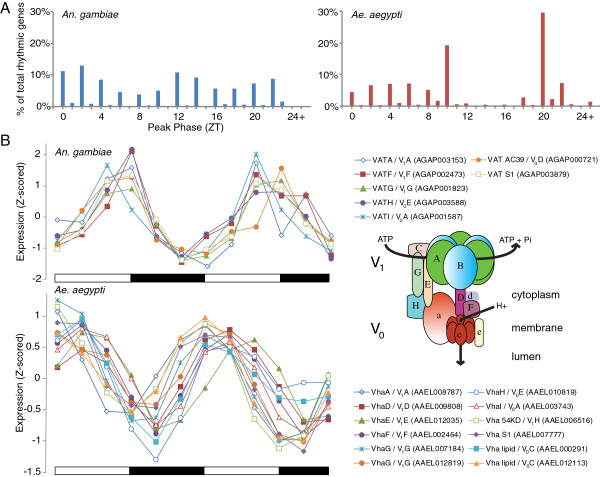
Figure 4.
Timing of gene expression in An. gambiae and Ae. aegypti. (A) Peaks of transcriptional expression compared between An. gambiae and Ae. aegypti. Data are binned according to their time value up to and including the phase indicated. Indicated percentages are the proportion of genes that are rhythmic (JTK_CYCLE, q < 0.05) at that peak phase. For genes with multiple rhythmic probes, only the probe with the lowest q value was considered. (B) Multiple subunits of the vesicular-type ATPase are rhythmically expressed in both An. gambiae and Ae. aegypti, but in antiphase. Expression data have been Z-scored. Seven and 10 of the V-ATPase subunit genes are rhythmically expressed and are mostly phase concordant in An. gambiae and Ae. aegypti, respectively. The peak in expression between the two species, however, are in opposite phases. Ae. aegypti subunits and An. gambiae V-type proton ATPase catalytic subunit A (VATA, AGAP003153) are named in VectorBase. All other genes shown are orthologs predicted using the Database for Annotation, Visualization, and Integrated Discovery (DAVID) [103,104]. As Anopheles collection began at dusk (ZT 12) and Ae. aegypti collection at dawn (ZT 0), the second and third timepoints from the Anopheles collection are appended to the end of the collection as the last two timepoints for visualization purposes. Inset cartoon is a model of V-type H+ ATPase showing the V1 and V0 complexes. Day and night are indicated by the horizontal white/black bars below the charts. All data shown are from LD heads.

