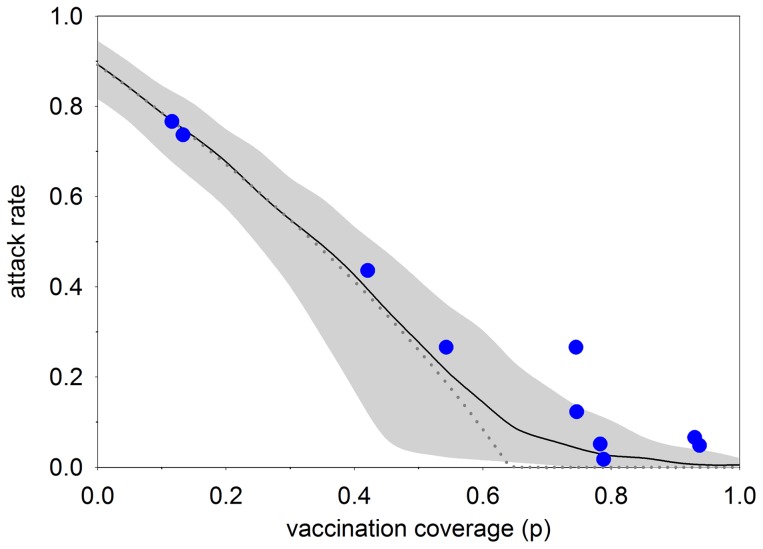
Figure 2. Relation between vaccination coverage and overall attack rate in the baseline scenario.
The figure shows the medians of the posterior vaccination coverages versus posterior attack rates in the ten schools (blue dots), the deterministic final size attack rate using the posterior medians of the basic reproduction number and vaccine efficacy (dotted line), and the results of simulations in populations of size 200 using samples from the posterior distributions of the basic reproduction number and vaccine efficacy (black line: median; grey area: 2.5%–97.5% percentiles). See text for details.

