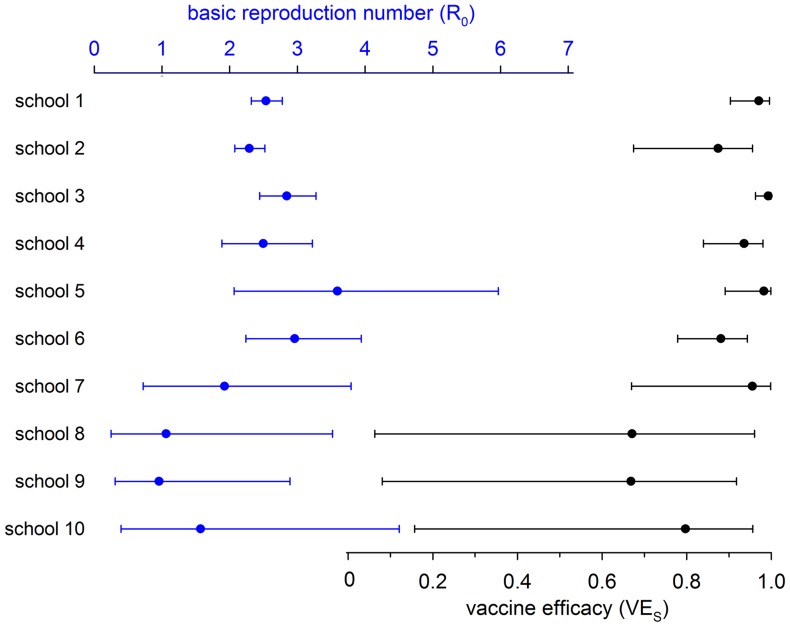
Figure 3. Estimated reproduction numbers (top, blue dots) and vaccine efficacies (bottom, gray dots) per school, with associated 95% credible intervals (cf. Table 3).
Note that estimated vaccine efficacy is consistently high in schools with high exposure (schools 1–6), but cannot be estimated with any precision in schools with low exposure (schools 8–10).

