
Figure 11. RT-qPCR of E. festucae iron-regulated genes and Nox genes in ΔsidN infected perennial ryegrass.
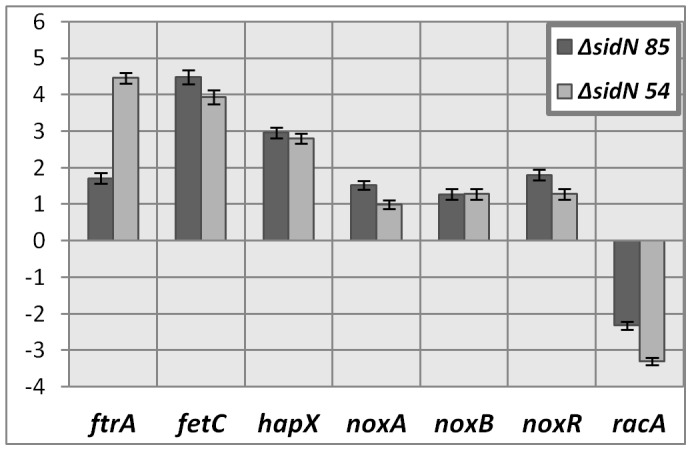
Relative mean abundance relative to wild-type (fold difference displayed) of iron regulated gene expression (ftrA, fetC, hapX) and Nox gene expression (noxA, noxB, noxR, racA) in perennial ryegrass infected with ΔsidN mutants 54 and 85 are shown. For ftrA, fetC, noxA and racA results have a p-value of <0.001 and for hapX, noxB and noxR, the p-values are 0.002, 0.005 and 0.017 respectively. Error bars indicate SED.