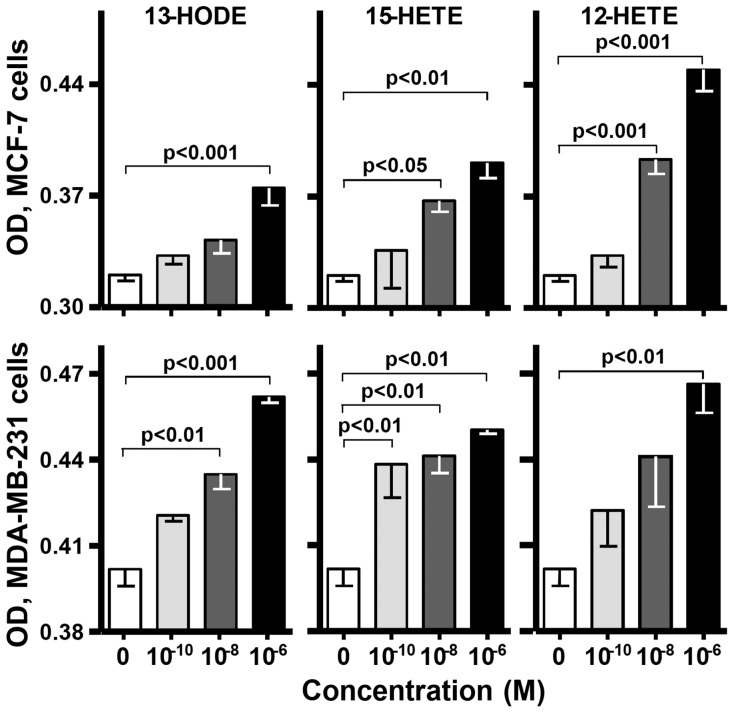
Figure 1. Cell growth.
MCF-7 (upper panels) and MDA-MB-231 (lower panels) cell cultures were challenged with a metabolite for 48 hr and assayed for cell density. One-way ANOVA gave the statistical significances shown between comparisons of cells treated with 0 (culture media) or 100 pM–1 µM of the indicated metabolite. Data are means ±SEM in ODU490 of 3–6 cultures.

