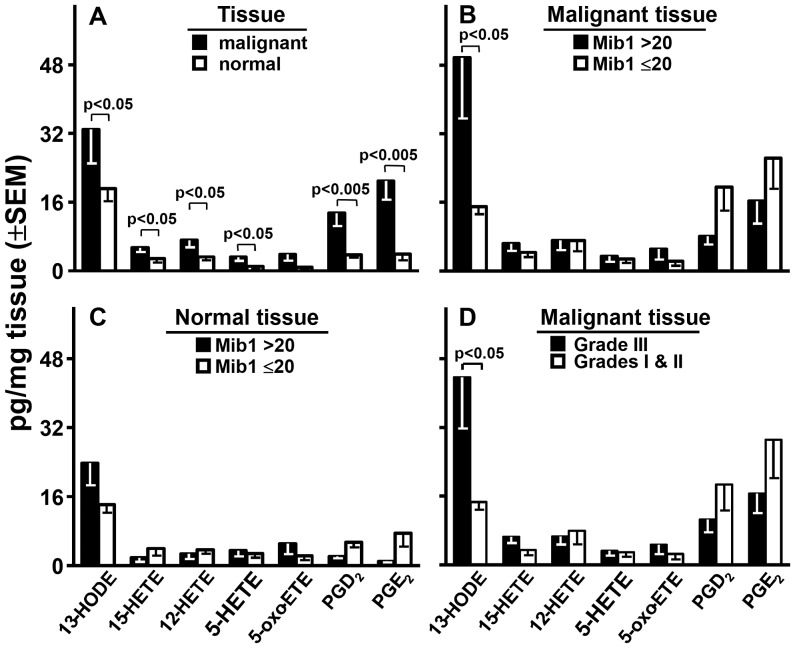
Figure 2. Metabolites and Mib1.
Levels of the metabolites are compared by tissue type (panel A), Mib1 score in malignant (panel B) or normal (panel C) tissue; and grade in malignant tissue (panel D). Probability values were defined by paired (panel A) or unpaired (panels B, C, and D) Student t-tests and were corrected for the 7 comparisons made in each panel by the false discovery rate method.

