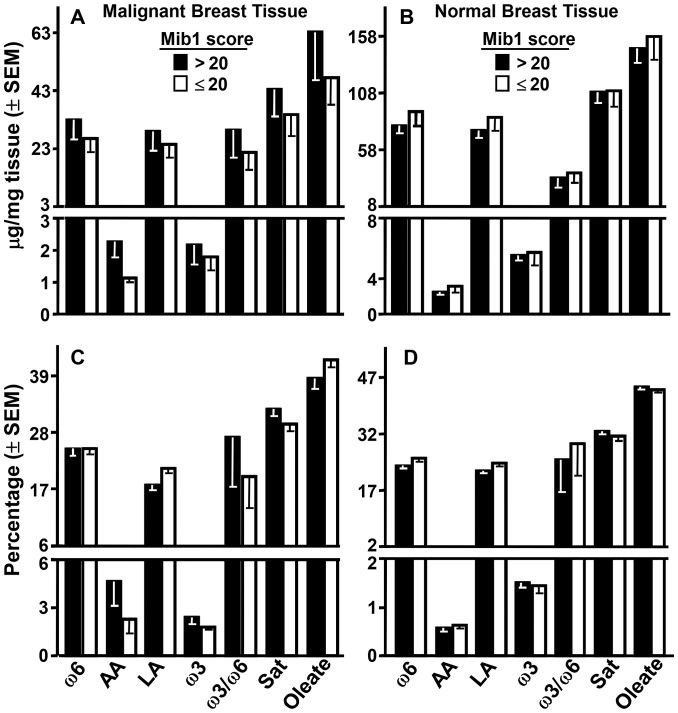
Figure 4. FA and Mib1.
Levels of the indicated FA are presented as mass (upper panels) or percentage of total recovered FA (lower panels) in malignant (left panels) and normal (right panels) breast tissue of patients with high or low Mib1 scores. Comparison of the 7 FA parameters on the basis of high or low Mib1 score by Students t-test gave no significant differences even before correction for multiple comparisons; the same analysis in RBC and plasma likewise revealed no significant differences as a function of Mib1 scores (results not shown).

