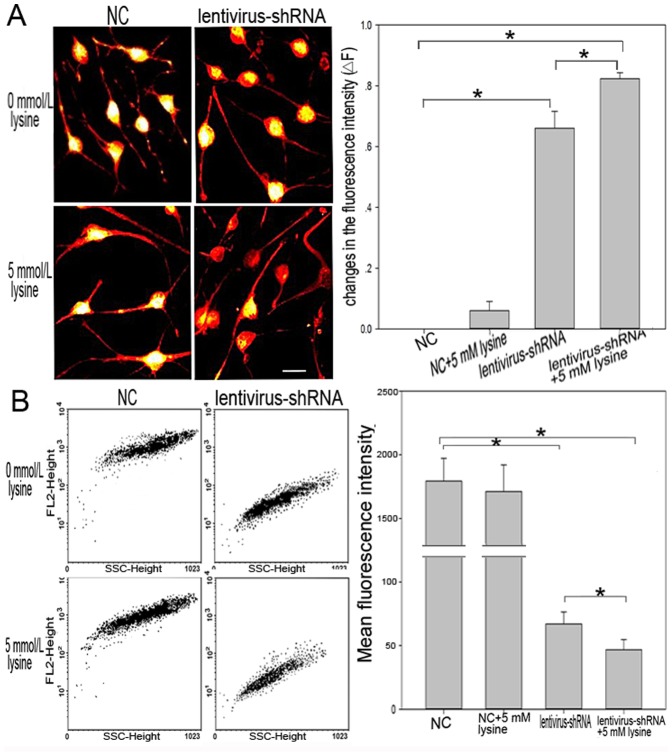
Figure 5. Assessment of MPP in rat striatal neurons.
A: Fluorescence images of rat striatal neurons incubated with TMRM. Lentivirus-shRNA#1 leads to mitochondrial depolarization and loss of fluorescence intensity. The loss of TMRM fluorescence from the mitochondrial regions indicates the collapse of MPP upon lentivirus-shRNA#1 and lysine treatment. Scale bars: 20 µm. The histogram shows the quantitative representation of changes in the fluorescence intensity of TMRM upon different treatments. △F = (F0–F)/F0; F0: TMRM fluorescence intensity in the lysine-free NC group; F: TMRM fluorescence intensity in other groups. *P<0.05. B: MPP was assessed using flow cytometry. Abscissa represents SSC-height (side scatter height), ordinate intensity of fluorescence. The histogram shows the changes in mean fluorescence intensity of all the cells. *P<0.05.

