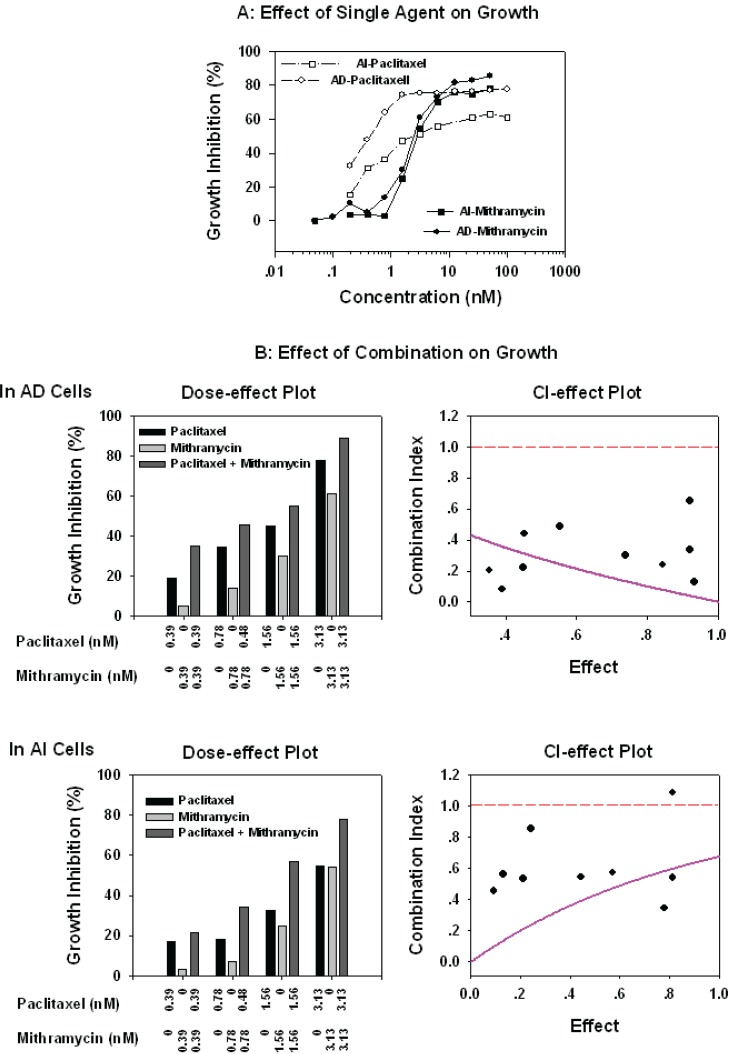
Figure 5.
Inhibitory of Mithramycin and paclitaxel alone (panel A) or in combination on cell growth (panel B): AD and AI cells grown exponentially in 96-well dishes were exposed to a series dilution of Mithramycin or paciltaxel or Mithramycin plus paciltaxel at ratio of 1:1 for 3 days. The cells growth was measured by MTT using a standard protocol, percentages of growth inhibition (1-T/C)% calculated, and the combination index (CI) analyzed by a computer program, CalcuSyn, of Biosoft as described in the “Materials and Methods.” The read dash-line in Effect-CI plot represents the CI value equal to 1 (additive). The values above the line indicate antagonism, and below the line are synergistic. The pink line stimulated by the computer program represents the trend of the combination.

