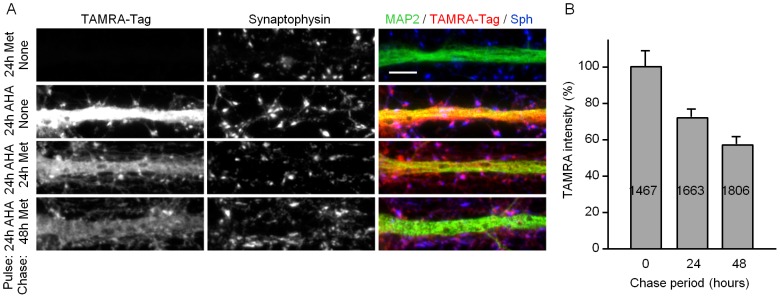
Figure 4. Degradation rates of newly synthesized proteins measured in dendritic spines.

A 24 h pulse with 4 mM AHA was used to label newly synthesized proteins. Cells were subsequently fixed - immediately or after 24 or 48 h chase periods with high concentrations of methionine. Newly synthesized proteins (proteins containing AHA) were then visualized with a TAMRA-TAG using FUNCAT. A) Examples of proximal dendritic segments after visualization of newly synthesized proteins by FUNCAT, and after immunostaining against MAP2 and Synaptophysin (Sph). Note the strong TAMRA fluorescence in dendrites as well as in Synaptophysin positive synapses, and the reduction in TAMRA fluorescence after 24 and 48 h chase periods. Note also that no TAMRA fluorescence is observed in neurons that were not exposed to the AHA pulse (top row). Color coding: MAP2 - green, TAMRA-tag - magenta/red, Sph - blue. Scale bar: 5 µm. B) Quantification of TAMRA fluorescence intensity in synaptophysin-positive synapses following increasingly longer chase periods. Data is shown as average ± SEM. Data obtained from two independent experiments (two to three coverslips per experiment) and a total number of 40–46 proximal dendrites. The number of spines for which TAMRA-intensity was quantified is indicated inside the bars.
