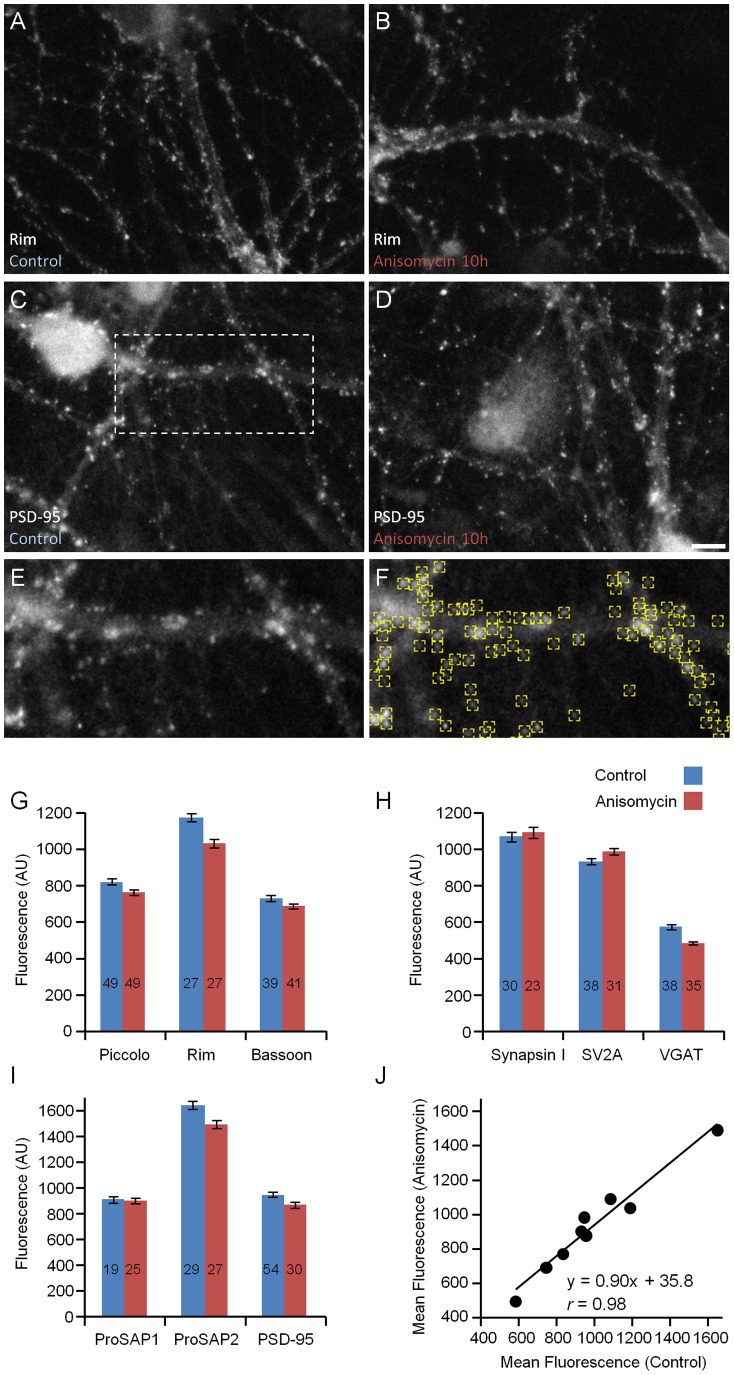
Figure 5. Minor loss of synaptic proteins from synaptic sites following suppression of protein synthesis for 10 hours.
Quantitative immunocytochemistry of neurons exposed to the protein synthesis blocker anisomycin (25 µM) for 10 hours and thereafter labeled against nine different synaptic proteins. Neurons labeled against the CAZ protein Rim after exposure to carrier solution (A) or anisomycin (B). Neurons labeled against the PSD protein PSD-95 after exposure to carrier solution (C) or anisomycin (D). Scale bar, 10 µm. E) Enlarged view of region enclosed in the rectangle in C illustrating a programmatic localization of fluorescent puncta (F). Note that puncta are detected correctly regardless of their brightness. G–I) Changes in synaptic immuofluorescence levels measured following exposure to anisomycin for 10 hours (average ±SEM). Numbers within bars indicate the number of fields of view analyzed for each data set. Each field of view contained ∼297±122 puncta (average ± standard deviation). J) Average immuofluorescence levels following anisomycin treatment plotted against immunofluorescence levels in untreated neurons (same data as in panels G–I).

