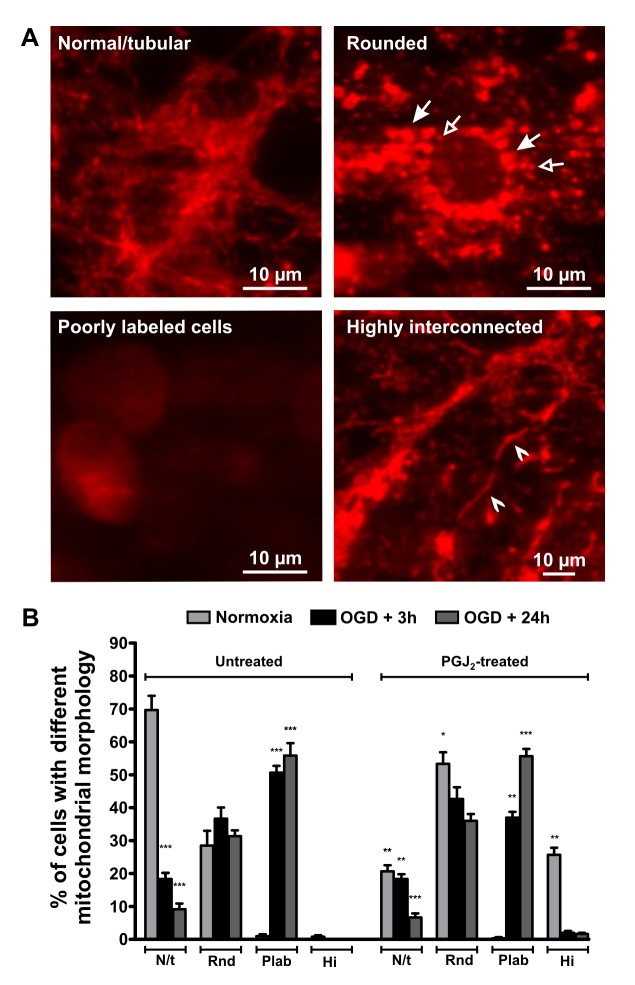
Figure 1. Changes in mitochondrial morphology in neurons following OGD.
Representative images of neurons with different mitochondrial morphology with live mitochondrial staining are shown (A). Arrows point to some large, rounded (with filled arrowhead) and small, rounded (with empty arrowhead) mitochondria (top right picture). Poorly labeled cells are shown on the bottom left picture, and arrowheads point to highly interconnected mitochondria on the bottom right picture. The graph (B) shows the percentages of neurons with different forms of mitochondrial morphology in normoxic and OGD conditions with or without PGJ2 treatment. An increased percentage of poorly labeled mitochondria containing cells were seen following 3 h OGD with a decreased number of normal, tubular shaped mitochondria. The number of rounded mitochondria containing cells did not change significantly after OGD, having both small and large mitochondria. PGJ2 treatment (10 µM for 3 h) increased the ratio of highly interconnected mitochondria in the control cells, but did not affect mitochondrial shape compared to untreated OGD cells. Please note that the y-axis of the graph is the percentage of cells with different mitochondrial morphology and NOT the percentage of mitochondria with different morphology per cell. *p<0.05 **p<0.005 ***p<0.001 vs. untreated control of the same group, n≥3 independent experiments. N/t = Normal/tubular or short/tubular, Rnd = Rounded, Plab = poorly labelled, Hi = Highly interconnected. OGD = oxygen-glucose deprivation, PGJ2 = 15-deoxy-D12,14-prostaglandin J2.

