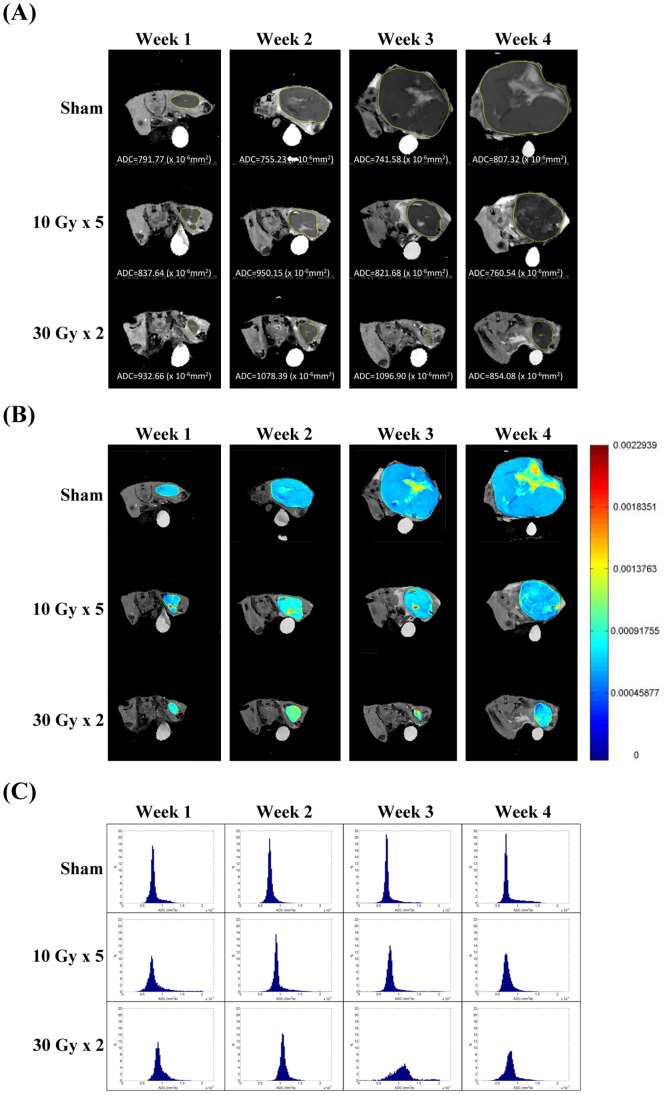
Figure 2. MR, apparent diffusion coefficient (ADC) parametric map, and normalized histogram from representative animals.
(A) ADC mapping on diffuse-weighted images, (B) ADC parametric maps, and (C) normalized histograms of ADC values of one representative mouse from each treatment group at the indicated time points.

