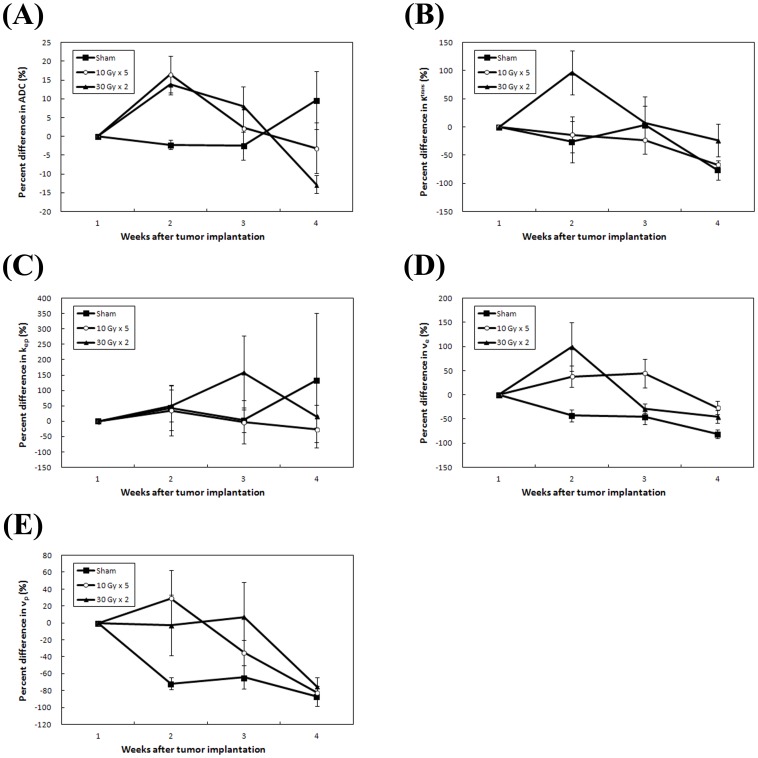
Figure 4. Plots of percent change in functional MRI parameters for each of the treatment groups.
Percent changes of (A) apparent diffusion coefficient (ADC), (B) Ktrans, (C) kep, (D) ve, and (E) vp, of mice in three treatment groups were shown at each time point from week 1 (baseline) to week 4. Data presented were the mean ± SEM.

