
Fig. 3.
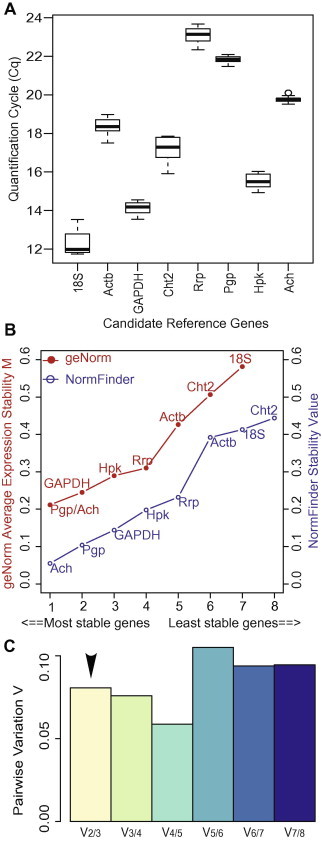
Identification of the most stable reference genes. (A) Expression levels of candidate reference genes. The expression levels in the 12 samples are represented as quantification cycle (Cq) values obtained from the qPCR experiments. The median is indicated by a line in each box and the box defines the 25th and 75th percentiles. Whiskers represent the 10/90 percentile ranges. Circles represent the potential outliers. (B) Ranking of candidate reference genes according to gene expression stability. Expression stability was evaluated using two different algorithms implemented in geNorm and NormFinder. The genes with lower stability values were more stably expressed. (C) Pairwise variation analysis to determine the optimal number of reference genes for normalization. The V2/3 value is below the proposed cut-off of 0.15, which indicates that the two genes are adequate for the accurate normalization of the gene expression data.