
Fig. 2.
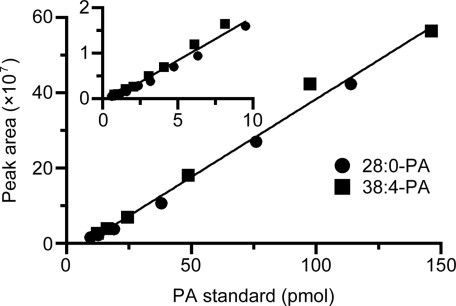
Standard curves obtained with the LC/ESI-MS method and PA standards (28:0- and 38:4-PA). The main panel shows the high-range standard curve (9.50–146 pmol; y = 4.14 × 10⁶x –29.74 × 10⁶, r = 0.995) and the inset exhibits the low-range standard curve (0.59–9.50 pmol; y = 1.90 × 10⁶x –1.05 × 10⁶, r = 0.985).