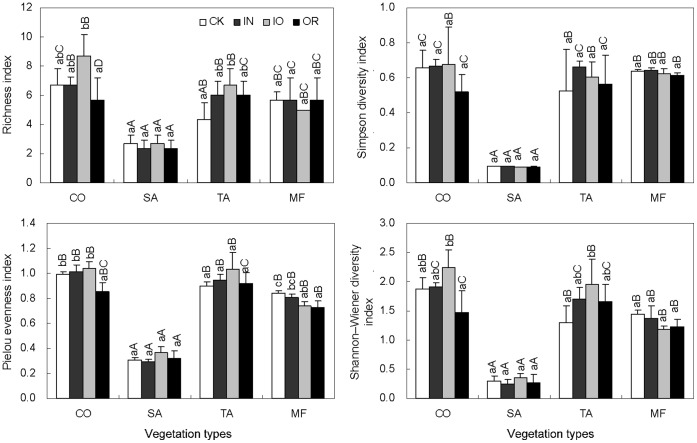
Figure 1. Plant species richness index, Shannon-Wiener diversity index, Simpson diversity index, and Pielou evenness index in the reclaimed mining area.
Points show the means of three replicates, and vertical bars show standard deviations. Treatments with the same lower case letters are not significantly different from one another for the same regeneration scenario (P>0.05). Treatments with the same capital letters are not significantly different from one another for the same fertilizer treatment (P>0.05). CO, SA, TA, and MF represent Lotus corniculatus, Medicago sativa, Pinus tabulaeformis, and Salix matsudana–Sabina chinensis mixed forest. CK, IN, IO, and OR represent no fertilizer, inorganic, organic, and a combination of inorganic and organic fertilizer added to soils.

