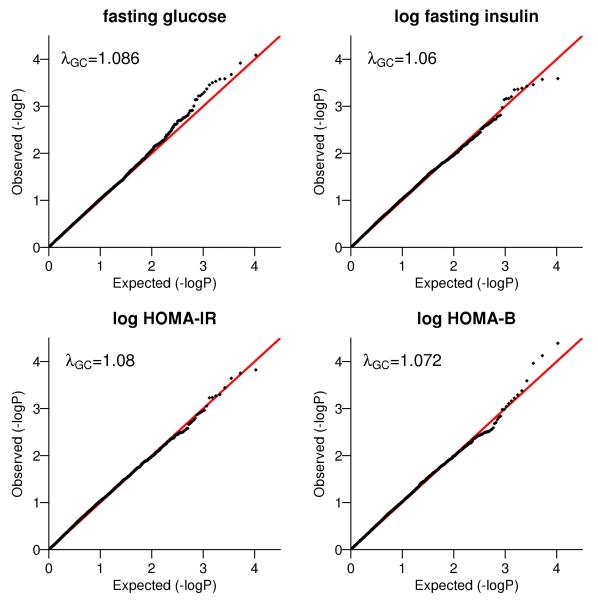
Figure 3.
Q-Q plots for famSKAT in the genome-wide sliding window analysis on four glycemic traits. The p-values were plotted as minus log base 10 p-values. The genomic control factor λGC was computed as the ratio of median chi-square statistics with 1 df corresponding to observed and expected p-values.

