Figure 6.

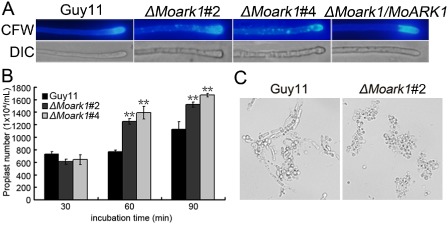
Mycelial calcofluor white (CFW) staining and protoplast release assay. (A) Disruption of MoARK1 altered the distribution of chitin on the cell wall. Wild‐type and mutant hyphae were stained with 10 μg/mL CFW for 5 min without light before being photographed. The experiment was repeated three times with triplicates, and displayed the same results. DIC, differential interference contrast image. (B) Protoplast release assay of Guy11 and ΔMoark1 mutants. Asterisks indicate a significant difference between the mutants and wild‐type strain at P < 0.01, according to Duncan's range test. (C) Light microscopic examination of protoplast release after 40 min.
