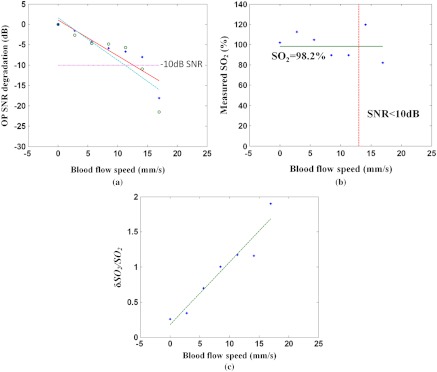
Fig. 9.

(a) SNR degradation versus blood flow speed. Circle: SNR in response to 770-nm excitation, dashed line: linear fit, diamond: SNR in response to 800-nm excitation, solid line: linear fit, dotted line: 10-dB SNR degradation. (b) measurement in blood vessel phantom at various blood flow speeds. Diamond: measured by DWP-OCT, solid line: measured by oximeter (98.2%), dashed line: threshold speed above which SNR degradation exceeds 10 dB. (c) Relative blood measurement error () for a single segment (0.5 s) versus blood flow speed. Dashed line is linear fit.
