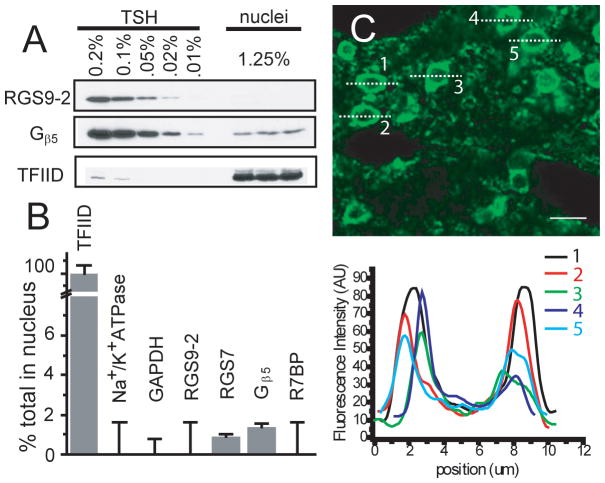
Figure 3.
Examination of endogenous RGS9-2 and associated proteins in cell nuclei of mouse striatum. A. Immunoblot used to determine relative protein levels in cell nuclei isolated by sucrose gradient versus a standard curve determined from mouse total striatal homogenate (TSH). Amounts shown are percentage of total with the nuclear amount normalized by the yield of nuclear marker TFIID. B. The relative amount of each protein found in the nuclear fraction as determined by immunoblotting normalized by the yield of the nuclear marker TFIID. C. Immunoflurescence staining of mouse striatal sections from C57/Bl6 using the R1754 antibody and antigen retrieval. Profiles of the fluorescence intensity through 5 representative neurons are plotted below. The vast majority of RGS9-2 staining appears around the cell periphery rather than the cell interior. Scale bar = 10 μm.

