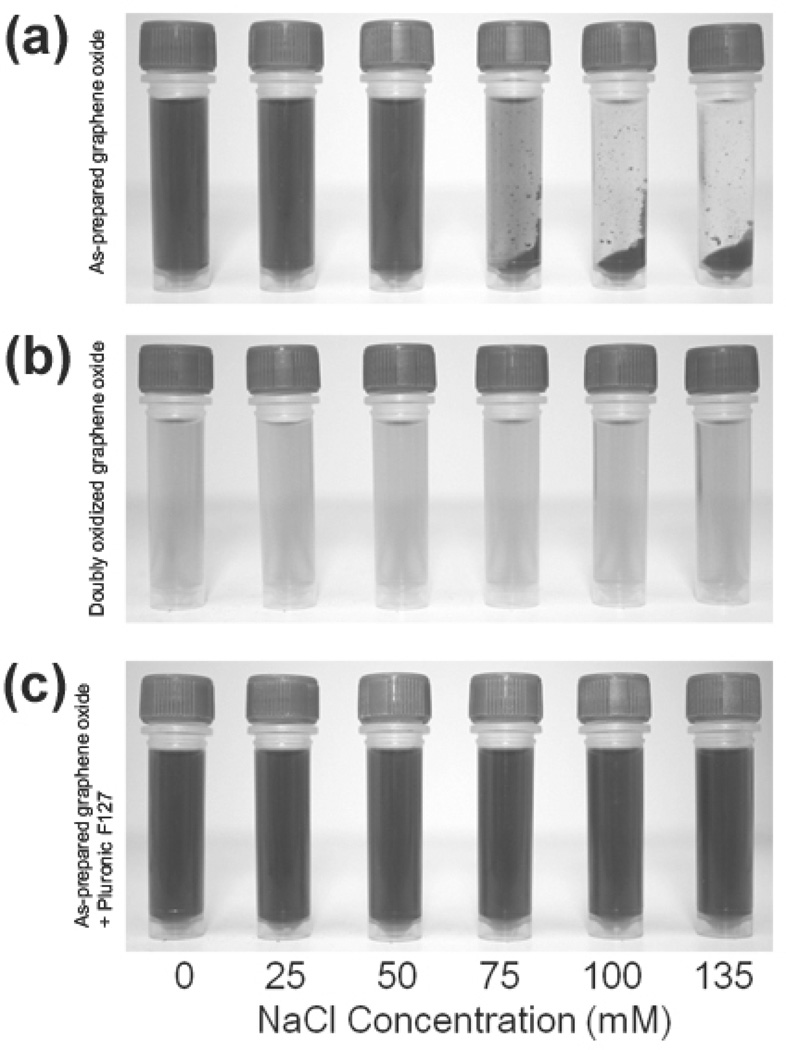
Figure 2.
Digital images of solutions of: (a) as-prepared graphene oxide (0.1 mg mL−1) in the presence of NaCl, (b) doubly oxidized graphene oxide (0.1 mg mL−1) in the presence of NaCl, and (c) as-prepared graphene oxide (0.1 mg mL−1) in the presence of Pluronic F127 (1.0 mM) and NaCl. Images were recorded 5 min after the graphene oxide formulations were mixed with aqueous solutions containing increasing NaCl concentrations (from left to right: 0, 25, 50, 75, 100, and 135 mM final salt concentrations). Samples were briefly centrifuged (~30 sec) to accentuate the aggregation of nanosheets into concentrated masses at the bottom of the tube, if any occurred. A color reproduction of this figure is available in the SI as Figure S1.

