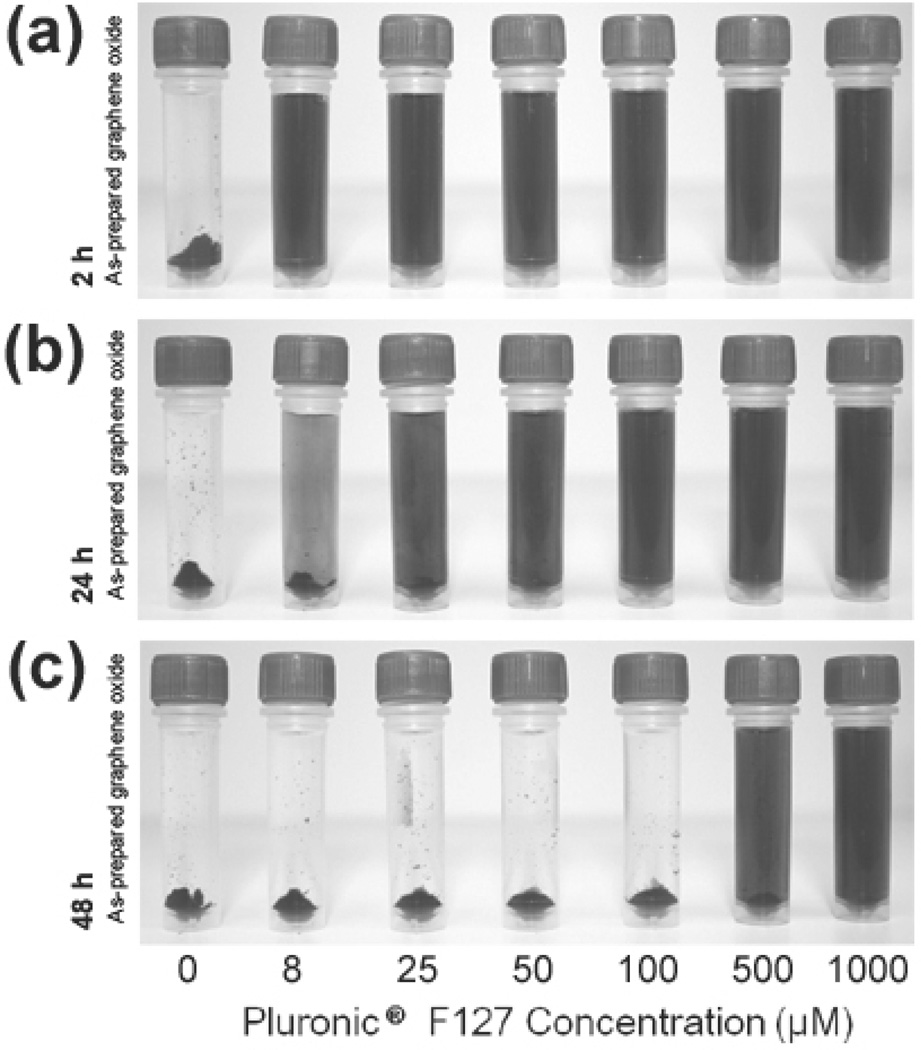
Figure 5.
Digital images of solutions of as-prepared graphene oxide dispersions (0.1 mg mL−1) taken after incubation for (a) 2 h, (b) 24 h, and (c) 48 h in aqueous solutions of NaCl (75 mM). The concentrations of Pluronic F127 in the mixture are increased from left to right (0, 8, 25, 50, 100, 500, and 1000 µM) and are listed below the image. Samples were briefly centrifuged (~30 sec) to accentuate the extent of aggregation of the nanosheet into powders at the bottom of the tube, if any. A color reproduction of this figure is available in the SI as Figure S8.

