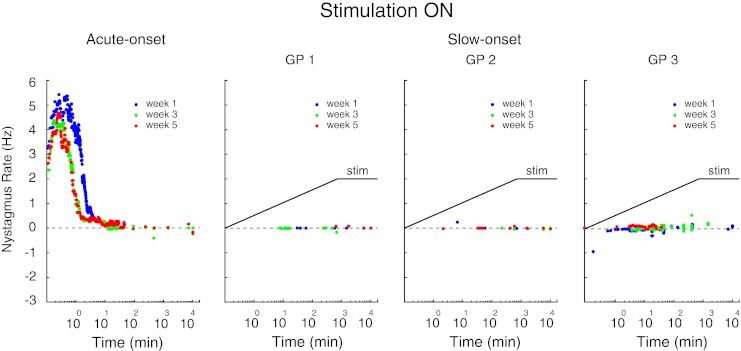
FIG. 2.

The nystagmus rate for the acute-onset guinea pig and for the three slow-onset guinea pigs (GP1, GP2, GP3) for each of the three stimulation-on transitions (weeks 1, 3, 5). The nystagmus rate is shown for the entire week of data collection in the stimulation-on state. For the slow-onset protocol, the rate of stimulation (stim) is shown schematically by the solid line: the stimulation rate increased linearly for the first 12 h of each stimulation cycle and then remained constant at 250 pps for the remainder of the week (note that for simplicity the stimulation rate is shown as a linear ramp even though time on the x axis is plotted on a log scale).
