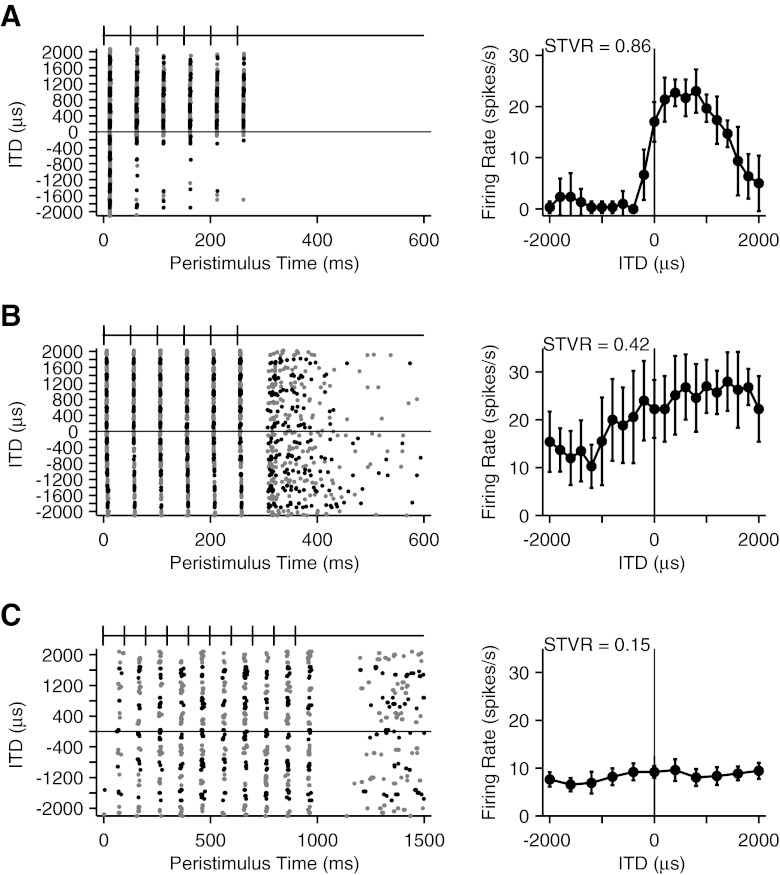
FIG. 1.
ITD sensitivity varies widely across IC neurons in long-term, adult-deafened cats. LEFT COLUMN, dot rasters show temporal discharge patterns as a function of ITD. Alternating colors distinguish blocks of responses to different ITDs. Stimulus pulse trains shown on top of each raster plot. Pulse rates were 20 pps (A, B) and 10 pps (C). RIGHT COLUMN, corresponding rate-vs.-ITD curves (mean ± SD). STVR ITD signal to total variance ratio. Examples show good (A), intermediate (B), and poor (C) ITD sensitivity.

