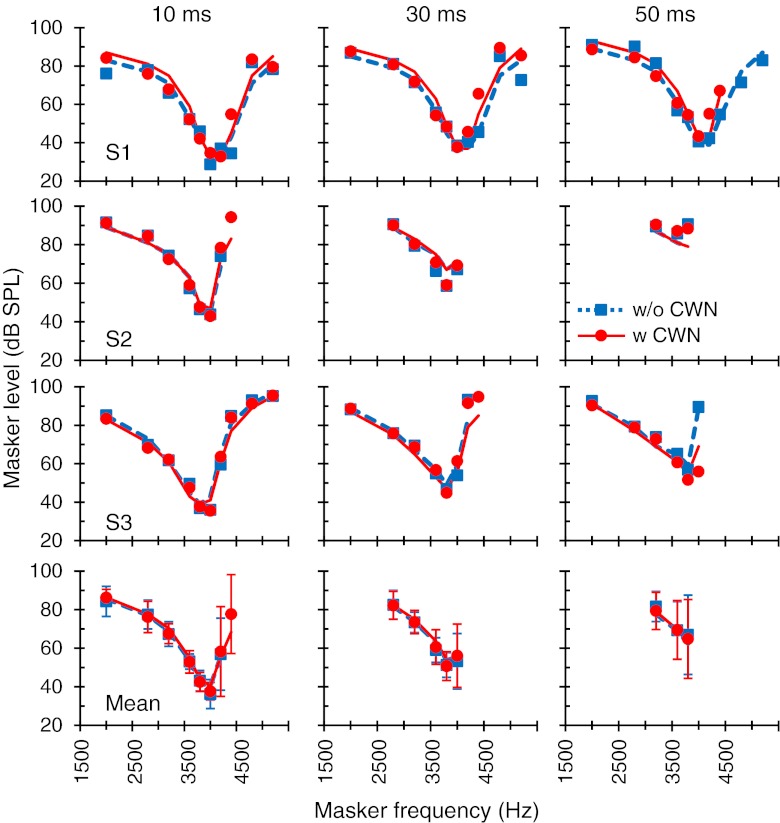
FIG. 5.
The effect of the CWN on suprathreshold PTCs for a probe frequency of 4 kHz. Each column illustrates PTCs measured using a different masker–probe time gap, as indicated at the top. Symbols and lines illustrate measured and modeled data, respectively. Each row shows results for a single subject or the mean, as indicated in the bottom-left corner of the left panels. Missing symbols correspond to conditions for which it was not possible to obtain three or more valid measurements using the criteria explained in “Materials and methods.” In the bottom panels, error bars are associated to the symbols and illustrate ± one standard deviation.

