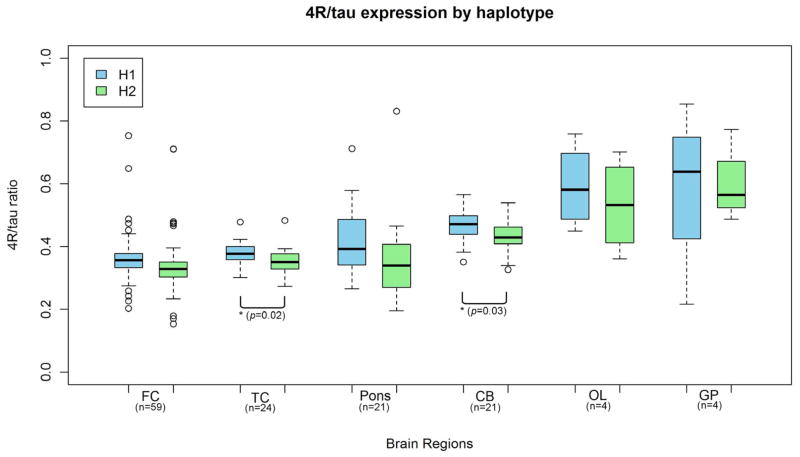
Figure 3. Variation in relative 4R-tau expression by haplotype in controls.
There was a trend for higher expression of 4R-tau from the H1 haplotype compared to the H2 haplotype. The variation reached statistical significance in the temporal cortex and cerebellum (p <0.05; equal variance two-sample t-test). FC, frontal cortex; TC, temporal cortex; CB, cerebellum; OL, occipital lobe; GP, globus pallidus, n, number of samples available for each group.

