FIGURE 4.
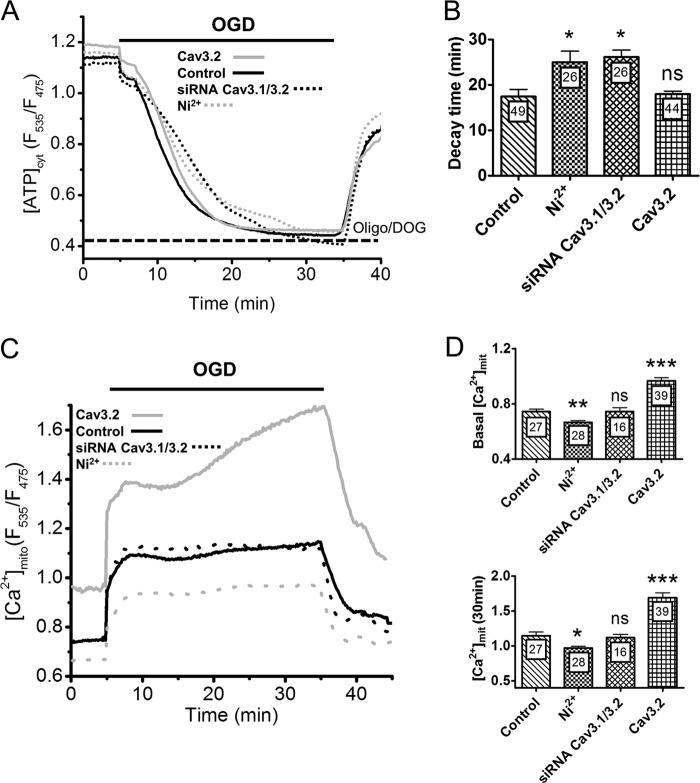
Effect of T-type channels activity on cytosolic ATP levels and on [Ca2+]mit during OGD. A, averaged ATeam ratio fluorescence recordings during OGD. [ATP]cyt levels decreased monotonically to reach a minimal value within 15 min and increased immediately upon reoxygenation. The dotted line indicates the level measured in cells exposed to 10 μg/ml oligomycin and 10 mm 2-deoxyglucose. B, averaged decay time in [ATP]cyt levels during OGD. C, averaged [Ca2+]mit recordings from cells exposed to 30 min of OGD. Ni2+ decreased [Ca2+]mit at rest and throughout the OGD, whereas Cav3.2 overexpression increased resting [Ca2+]mit and caused a delayed [Ca2+]mit elevation during OGD. D, effect of T-type channels activity on resting [Ca2+]mit levels (top panel) and on [Ca2+]mit levels at the end of the 30-min OGD. Data are mean ± S.E. from three to five independent recordings. The total number of measured cells is indicated inside the bars. ns, non-significant; *, p < 0.05; **, p < 0.01; ***, p < 0.001 (Student's t test for unpaired samples).

