FIGURE 5.
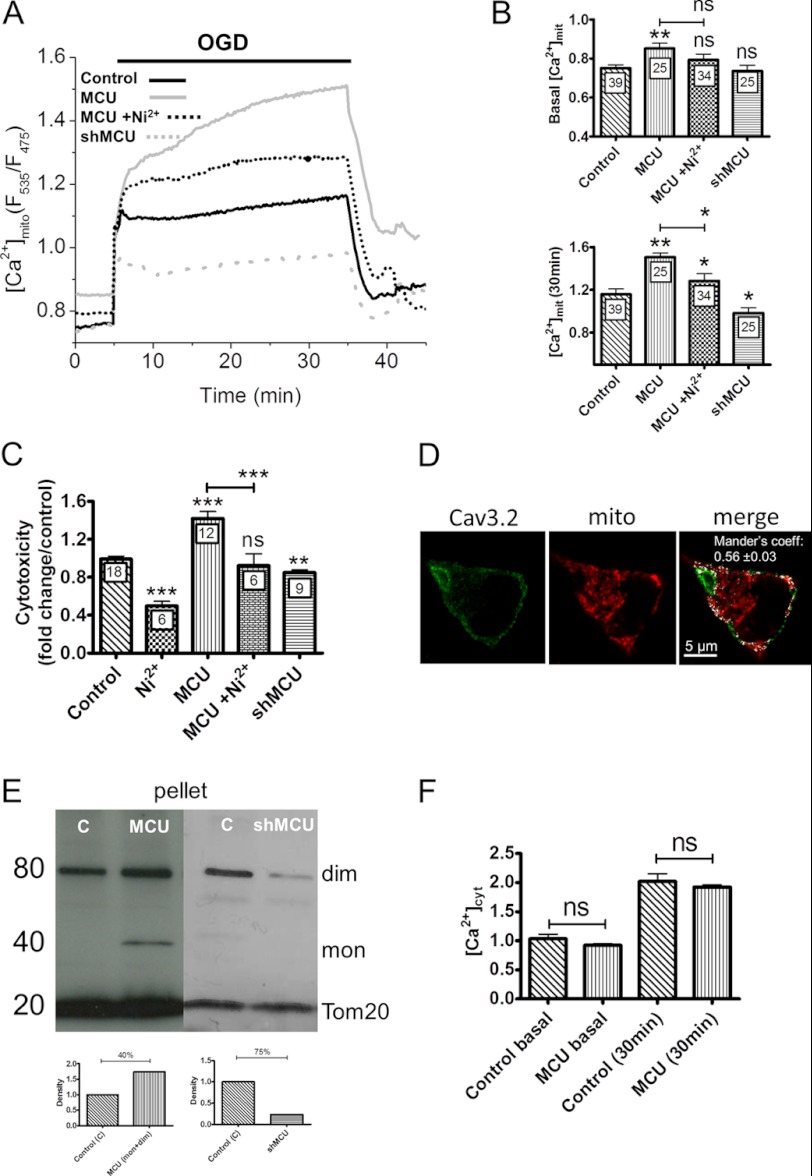
Effect of MCU overexpression of [Ca2+]mit elevations and cytotoxicity evoked by OGD. A, averaged [Ca2+]mit recordings from naïve, MCU-depleted, and MCU-overexpressing cells exposed to 30 min of OGD. Traces are the averaged [Ca2+]cyt responses measured in the indicated conditions. B, [Ca2+]mit levels recorded before and 30 min after the initiation of OGD under the different conditions. Data are mean ± S.E. from three to six recordings. The total number of measured cells is indicated inside the bars. C, effect of MCU silencing and overexpression on LDH release. Data are mean ± S.E. n is indicated inside the bars. D, Cav3.2 immunostaining in a cell expressing a matrix-targeted RFP. A significant fraction (56%) of the Cav3.2 immunoreactivity colocalized with the RFP fluorescence (white pixels). E, Western blot analysis showing the monomeric (mon) and dimeric (dim) forms of the MCU protein, which increased upon MCU overexpression (MCU) and decreased upon MCU silencing (shMCU) in a mitochondrial-enriched preparation. The insets show blot quantification. C, control. F, [Ca2+]cyt levels recorded before and 30 min after the initiation of OGD in naïve and MCU-overexpressing cells. Data are mean ± S.E. from three to six independent recordings. The total number of measured cells is indicated inside the bars. ns, non-significant; *, p < 0.05; **, p < 0.01; ***, p < 0.001 (Student's t test for unpaired samples).

