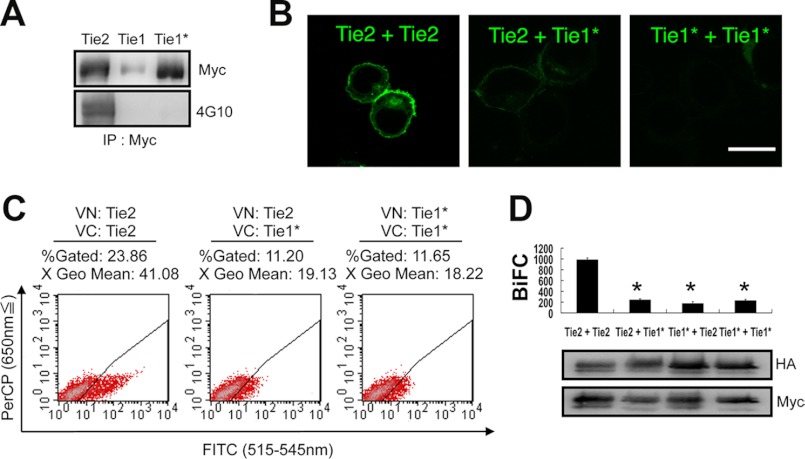
FIGURE 2.
BiFC analysis comparing Tie2 and Tie1*. A, signal peptide of Tie1 was replaced with that of Tie2 (Tie1*). All receptors were C-terminally tagged with Myc. The levels of Tie2, Tie1, and Tie1* protein were analyzed with Myc or 4G10 Ab. B–D, HEK293T cells were transiently transfected in combination with Tie2-HAVN and Tie2-MycVC, Tie2-HAVN and Tie1*-MycVC, or Tie1*-HAVN and Tie1*-MycVC. B, cells were analyzed by confocal microscopy. Bar indicates 20 μm. C, flow cytometric analysis for evaluation of receptor dimerization as indicated. D, quantitative evaluation of receptor dimerization in BiFC as shown in C (*, p < 0.05; n = 3). Protein expression level of each receptor was assessed by immunoblotting with anti-HA or anti-Myc Ab.

