
FIGURE 4.
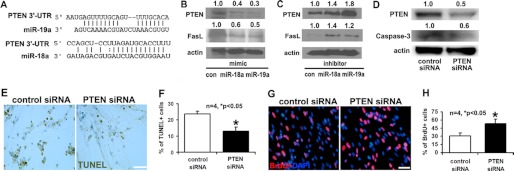
Panel A shows sequences of miR-18a and miR-19a binding sites in the 3′-UTRs of PTEN are predicted based on Targetscan software (version 5.1). Western blots (B and C) show protein levels of PTEN and Fas ligand in neural progenitor cells after transfection with miR-18a and miR-19a mimics (B) or miR-18a and miR-19a inhibitors (C). Control is cel-miR-67 (con). Panel D shows that protein levels of PTEN and caspase-3 were decreased in neural progenitor cells transfected with siRNA against PTEN, compared with those transfected with scrambled siRNAs. Intensity of the bands, normalized to actin and relative to the control lane, is shown above the images. Panels E and G show immunostaining of TUNEL and BrdU on neural progenitor cells transfected with PTEN or scrambled siRNAs. Panels F and H show the quantitative data of TUNEL- and BrdU-immunoreactive cells, respectively. *, p < 0.05. Scale bar, 20 μm.